AT&T Wireless 2009 Annual Report Download - page 52
Download and view the complete annual report
Please find page 52 of the 2009 AT&T Wireless annual report below. You can navigate through the pages in the report by either clicking on the pages listed below, or by using the keyword search tool below to find specific information within the annual report.-
 1
1 -
2
-
3
-
4
-
5
-
6
-
7
-
8
-
9
-
10
-
11
-
12
-
13
-
14
-
15
-
16
-
17
-
18
-
19
-
20
-
21
-
22
-
23
-
24
-
25
-
26
-
27
-
28
-
29
-
30
-
31
-
32
-
33
-
34
-
35
-
36
-
37
-
38
-
39
-
40
-
41
-
 42
42 -
 43
43 -
 44
44 -
 45
45 -
 46
46 -
 47
47 -
 48
48 -
 49
49 -
 50
50 -
 51
51 -
 52
52 -
 53
53 -
 54
54 -
 55
55 -
 56
56 -
 57
57 -
 58
58 -
 59
59 -
 60
60 -
 61
61 -
 62
62 -
63
-
64
-
65
-
66
-
67
-
68
-
69
-
70
-
71
-
72
-
73
-
74
-
75
-
76
-
77
-
78
-
79
-
80
-
81
-
82
-
83
-
84
-
85
-
86
-
87
-
88
-
89
-
90
-
91
-
92
-
93
-
94
-
95
-
96
-
97
-
98
-
99
-
100
 |
 |

Management’s Discussion and Analysis of Financial Condition and Results of Operations (continued)
Dollars in millions except per share amounts
50 AT&T 09 AR
expectation that regulatory and legislative decisions relating
to the telecom sector will continue to be sensitive to
investment.
Cash Used in or Provided by Financing Activities
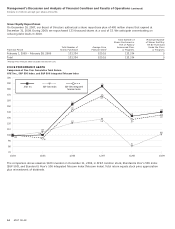
We paid dividends of $9,670 in 2009, $9,507 in 2008 and
$8,743 in 2007, reflecting dividend rate increases. In
December 2009, our Board of Directors approved a 2.4%
increase in the quarterly dividend from $0.41 to $0.42 per
share. This follows a 2.5% dividend increase approved by
AT&T’s Board in December 2008. Dividends declared by our
Board of Directors totaled $1.65 per share in 2009, $1.61 per
share in 2008 and $1.47 per share in 2007. Our dividend
policy considers both the expectations and requirements of
stockholders, internal requirements of AT&T and long-term
growth opportunities. It is our intent to provide the financial
flexibility to allow our Board of Directors to consider dividend
growth and to recommend an increase in dividends to be paid
in future periods. All dividends remain subject to approval by
our Board of Directors.
During 2009, we received net proceeds of $8,161 from the
issuance of $8,228 in long-term debt. Debt proceeds were
used for general corporate purposes, including the repayment
of maturing debt. Long-term debt issuances consisted of:
• $1,000of4.85%globalnotesduein2014.
• $2,250of5.80%globalnotesduein2019.
• $2,250of6.55%globalnotesduein2039.
• £750of5.875%globalnotesduein2017(equivalentto
$1,107 when issued).
• £1,100of7.0%globalnotesduein2040(equivalentto
$1,621 when issued).
We entered into cross-currency swaps to exchange the
above foreign currency proceeds and the future principal and
interest payments to U.S. dollars.
During 2009, debt repayments totaled $13,236 and
consisted of:
• $8,633inrepaymentsoflong-termdebt(includes
repayment of $1,957 for Centennial debt).
• $4,583inrepaymentsofcommercialpaperandshort-
term bank borrowings.
• $20inrepaymentsofotherdebt.
At December 31, 2009, we had $7,361 of debt maturing
within one year, which included $7,328 of long-term debt
maturities and $33 of other borrowings. Debt maturing within
one year includes the following notes that may be put back to
us by the holders:
• $1,000ofannualputresetsecuritiesissuedbyBellSouth
Corporation can be put each April until maturity in 2021.
• Anaccretingzero-couponnotemayberedeemedeach
May, excluding May 2011, until maturity in 2022. If the
zero-couponnote(issuedforprincipalof$500in2007)
is held to maturity, the redemption amount will be
$1,030.
We have a five-year credit agreement with a syndicate of
The decrease in current tax payments was partially offset
by an increase in audit-related payments in 2009.
We anticipate using approximately $2,350 of cash in 2010
tocompletetheacquisitionofvariousassetsfromVerizon
that it was required to divest as part of its acquisition
of Alltel.
During 2008, our primary source of funds was cash from
operating activities of $33,656 compared to $34,242 in 2007.
Operating cash flows decreased primarily due to increased
tax payments of $1,294 partially offset by improvement in
operating income excluding depreciation. During 2008, tax
payments were higher primarily due to increased income.
Cash Used in or Provided by Investing Activities
During 2009, cash used in investing activities consisted of:
• $16,595incapitalexpenditures,excludinginterestduring
construction.
• $740ininterestduringconstruction.
• $787,netofcashacquired,relatedtotheacquisitionof
Centennial.
• $111relatedtospectrumandlicenses.
• $85relatedtootheracquisitions.
During 2009, cash provided by investing activities consisted of:
• $287fromdispositionsofnon-strategicassets.
• $55fromthesaleofsecurities,netofinvestments.
• $51relatedtootheractivities.
Our capital expenditures are primarily for our wireless
and wireline subsidiaries’ networks, our U-verse services, and
support systems for our communications services. Total capital
spending in 2009 was $16,595, which was a $3,081 decrease
from 2008. Capital spending in our Wireless segment,
excluding interest during construction, only increased 1%
for 2009; the modest increase in capital spending reflected a
6% increase in network expenditures, tempered by reductions
in non-network spending. Expenditures were used for network
capacity growth, integration and upgrades to our Universal
Mobile Telecommunications System/High-Speed Packet Access
network, as well as for IT and other support systems for our
wireless service. Capital expenditures in our Wireline segment,
excluding interest during construction, which represented
64.3% of our capital expenditures, decreased 21% for 2009,
reflecting decreased spending on U-verse services as the
upgrades to our existing network become more mature. In
addition, capital expenditures decreased due to less spending
on wireline voice services, and lower DSL and High Capacity
volumes. The Other segment capital expenditures were less
than 2% of total capital expenditures for 2009. Included in
the Other segment are equity investments, which should be
self funding as they are not direct AT&T operations; as well
as corporate, diversified business and Sterling operations,
which we expect to fund using cash from operations.
We expect to fund any Advertising Solutions segment
capital expenditures using cash from operations. We expect
total 2010 capital investment to be in the $18 billion to
$19 billion range. This level of investment is framed by the