AT&T Wireless 2009 Annual Report Download - page 38
Download and view the complete annual report
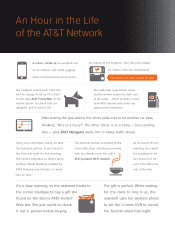
Please find page 38 of the 2009 AT&T Wireless annual report below. You can navigate through the pages in the report by either clicking on the pages listed below, or by using the keyword search tool below to find specific information within the annual report.-
 1
1 -
2
-
3
-
4
-
5
-
6
-
7
-
8
-
9
-
10
-
11
-
12
-
13
-
14
-
15
-
16
-
17
-
18
-
19
-
20
-
21
-
22
-
23
-
24
-
25
-
26
-
27
-
 28
28 -
 29
29 -
 30
30 -
 31
31 -
 32
32 -
 33
33 -
 34
34 -
 35
35 -
 36
36 -
 37
37 -
 38
38 -
 39
39 -
 40
40 -
 41
41 -
 42
42 -
 43
43 -
 44
44 -
 45
45 -
 46
46 -
 47
47 -
 48
48 -
49
-
50
-
51
-
52
-
53
-
54
-
55
-
56
-
57
-
58
-
59
-
60
-
61
-
62
-
63
-
64
-
65
-
66
-
67
-
68
-
69
-
70
-
71
-
72
-
73
-
74
-
75
-
76
-
77
-
78
-
79
-
80
-
81
-
82
-
83
-
84
-
85
-
86
-
87
-
88
-
89
-
90
-
91
-
92
-
93
-
94
-
95
-
96
-
97
-
98
-
99
-
100
 |
 |

Management’s Discussion and Analysis of Financial Condition and Results of Operations (continued)
Dollars in millions except per share amounts
36 AT&T 09 AR
higher commission rates. Interconnect and other costs also
increased by $141 due to increased usage and integration
costs related to the 2007 acquisition of Dobson. The increase
in reseller costs in 2008 was attributable to higher license,
maintenance and other reseller costs, partially offset by cost
reductions from the migration of network usage from the
T-Mobile USA (T-Mobile) network in California and Nevada
to our networks in these states.
These increases were partially offset by incollect roaming
cost decreases of $249 and network system cost decreases
of $132. The decrease in network system costs was the
result of benefits from network and systems integration
and cost-reduction initiatives of $218, decreases in data
processing and payroll costs of $109, partially offset by
incremental rents related to Dobson and general building
expense increases of $124, and hurricane and other
incremental network cost increases of $99.
Depreciation and amortization decreased $5, or 0.1%, in
2009 and decreased $1,309, or 18.5%, in 2008. Amortization
expense decreased $450, or 21.8%, in 2009 due to lower
amortization of intangibles attributable to the BellSouth
acquisition, partially offset by amortization of intangible assets
attrib utable to subscribers added in the November 2009
acquisition of Centennial and the 2007 acquisition of Dobson.
Deprec iation expense increased $445, or 12.0%, in 2009 due
to ongoing capital spending for network upgrades and
expan sion, partially offset by certain network assets becoming
fully depreciated.
Depreciation expense decreased $539, or 12.7%, in 2008.
Depreciation expense decreased $695 in 2008 due to certain
network assets becoming fully depreciated and decreased
$612 due to Time Division Multiple Access (TDMA) assets
being depreciated on an accelerated basis through 2007.
These decreases were partly offset by incremental depre-
ciation on capital assets placed in service during 2008.
Amortization expense decreased $770, or 27.2%, in 2008
due to declining amortization of identified intangible assets,
most of which are amortized using the sum-of-the-months-
digits method of amortization, partially offset by Dobson
intangible assets acquired by AT&T Mobility.
Operations and support expenses increased $2,080, or
6.4%, in 2009, compared to an increase of $3,896, or 13.6%, in
2008. The increase in 2009 was primarily due to the following:
• equipmentcostincreasesof$1,246,reflectingthehigher
cost of acquiring more advanced integrated devices
compared to prior periods;
• Interconnect,universalservicefee(USF)andreseller
expense increases of $426 due to higher network traffic
and revenue growth;
• upgradecommissionsandresidualexpenseincreasesof
$313 due to sales and upgrades to more advanced
devices;
• customerservicecostincreasesof$214duetocustomer
growth; and
• Finance,IT,andotheradministrativecostincreasesof
$306.
These increases were partially offset by selling expense
decreases of $337, attributable to lower traditional handset
sales exceeding the impact of the sale of more advanced
integrated devices and roaming expense decreases of $165
due to usage and rate declines. Total equipment costs
continue to be higher than equipment revenues due to the
sale of discounted devices in connection with promotions.
The increase in 2008 was primarily due to the following:
• equipmentsalesexpenseincreaseof$2,005;
• upgradecommissionsandresidualexpenseincreases
of $745;
• sellingexpenseincreaseof$362andcustomerservice
cost increase of $159;
• USFincreaseof$204andresellerexpenseincreaseof
$145; and
• Finance,IT,andotheradministrativecostincreases
of $538.
The increase in equipment sales expense, commission
expense, and selling expense resulted from an increase in
sales of higher-cost 3G devices, the introduction of Apple
iPhone 3G handsets in 2008, an increase in the number of
handset accessory sales, lower per-unit accessory costs
compared to 2007, and higher handset upgrade volume.
The increase in commission expense is also attributable to
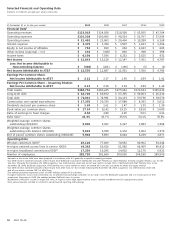
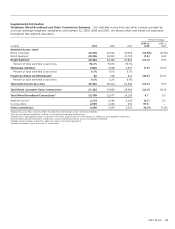
Wireless Supplementary Operating and Financial Data
Percent Change
2009 vs. 2008 vs.
2009 2008 2007 2008 2007
Wireless Customers (000) 85,120 77,009 70,052 10.5% 9.9%
Net Customer Additions (000) 7,278 6,699 7,315 8.6 (8.4)
Total Churn 1.48% 1.68% 1.67% (20) bps 1 bps
Postpaid Customers (000) 65,146 60,098 55,310 8.4% 8.7%
Net Postpaid Customer Additions (000) 4,323 4,634 3,982 (6.7) 16.4
Postpaid Churn 1.16% 1.19% 1.27% (3) bps (8) bps