AT&T Wireless 2009 Annual Report Download - page 40
Download and view the complete annual report
Please find page 40 of the 2009 AT&T Wireless annual report below. You can navigate through the pages in the report by either clicking on the pages listed below, or by using the keyword search tool below to find specific information within the annual report.-
 1
1 -
2
-
3
-
4
-
5
-
6
-
7
-
8
-
9
-
10
-
11
-
12
-
13
-
14
-
15
-
16
-
17
-
18
-
19
-
20
-
21
-
22
-
23
-
24
-
25
-
26
-
27
-
28
-
29
-
 30
30 -
 31
31 -
 32
32 -
 33
33 -
 34
34 -
 35
35 -
 36
36 -
 37
37 -
 38
38 -
 39
39 -
 40
40 -
 41
41 -
 42
42 -
 43
43 -
 44
44 -
 45
45 -
 46
46 -
 47
47 -
 48
48 -
 49
49 -
 50
50 -
51
-
52
-
53
-
54
-
55
-
56
-
57
-
58
-
59
-
60
-
61
-
62
-
63
-
64
-
65
-
66
-
67
-
68
-
69
-
70
-
71
-
72
-
73
-
74
-
75
-
76
-
77
-
78
-
79
-
80
-
81
-
82
-
83
-
84
-
85
-
86
-
87
-
88
-
89
-
90
-
91
-
92
-
93
-
94
-
95
-
96
-
97
-
98
-
99
-
100
 |
 |

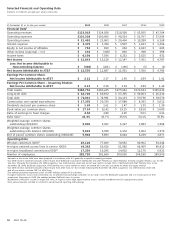
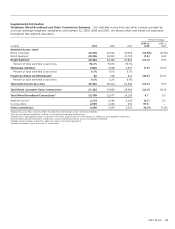
Management’s Discussion and Analysis of Financial Condition and Results of Operations (continued)
Dollars in millions except per share amounts
38 AT&T 09 AR
utilities on all buildings; credit and collection functions; and
corporate support costs, such as finance, legal, human
resources and external affairs. Pension and postretirement
costs, net of amounts capitalized are also included to the
extent that they are associated with these employees.
The 2009 decrease was primarily due to lower employee-
related costs of $918, primarily related to workforce
reductions. Other cost reductions included decreases in traffic
compensation (related to lower international long-distance
revenues and lower volume of calls from our declining
national mass-market customer base), including portal fees,
of $655, nonemployee-related expenses, such as bad debt
expense, materials and supplies costs, of $441 and $134
related to contract services.
Partially offsetting these decreases was an increase in
pension/OPEB expense of $1,370 due to a lower-than-
expected return on assets and an increase in amortization
of actuarial losses, both primarily from investment losses
in 2008. See Note 11 for more information related to
pension/OPEB expense.
The major decreases in 2008 were $633 in traffic
compensation (related to lower international long-distance
revenue, and lower volume of calls from our declining
national mass-market customer base), including portal fees,
and $618 of pension/OPEB expense. Other cost reductions
included decreases in other support cost of $616 primarily
due to higher advertising costs incurred in 2007 for brand
advertising and rebranding related to the BellSouth acquisition
and lower compensation expense of $420 reflecting shifts of
workforce levels to sales organizations.
Partially offsetting these decreases, operation and support
expenses increased by $1,135, related to higher nonemployee-
related expenses, such as contract services, agent commissions
and materials and supplies. Other increases were salary and
wages of $423; and higher cost of equipment sales and
related U-verse network integration of $60.
Depreciation and amortization expenses decreased
$113, or 0.9%, in 2009 and $210, or 1.6%, in 2008. The 2009
decrease was primarily related to lower amortization of
intangibles for the customer lists associated with ATTC,
BellSouth and Yahoo! partially offset by the inclusion of
Centennial related depreciation starting in the fourth quarter
of 2009. The 2008 decline was a result of decreasing intangible
amortization partially offsetting increased depreciation
resulting from capital additions.
IP data revenues increased $1,969, or 17.8%, in 2009 and
increased $1,537, or 16.1%, in 2008 primarily driven by AT&T
U-verse expansion and growth in IP-based strategic business
services, which include Ethernet, virtual private networks
(VPN), application and managed services. Strategic business
service revenues increased $603 in 2009 and $741 in 2008,
driven mostly by VPN, and U-verse video service increased
$980 in 2009 and $402 in 2008. Broadband high-speed
Internet access increased IP data revenues $300 in 2009 and
$497 in 2008. The increase in IP data revenues in 2009 and
2008 reflects continued growth in the customer base and
migration from other traditional circuit-based services.
Traditional packet-switched data services, which include
frame relay and asynchronous transfer mode services,
decreased $536, or 20.8%, in 2009 and $423, or 14.1%, in
2008. This decrease is primarily due to lower demand as
customers continue to shift to IP-based technology such as
VPN, DSL and managed Internet services, and the continuing
economic recession. We expect these traditional, circuit-based
services to continue to decline as a percentage of our overall
data revenues.
Other operating revenues decreased $439, or 7.0%, in
2009 and increased $426, or 7.2%, in 2008. Major items
included are integration services and customer premises
equipment, government-related services and outsourcing,
which account for more than 60% of total revenue for all
periods. Equipment sales and related network integration
revenues decreased $405 in 2009 primarily due to
economic pressures, and increased $260 in 2008, driven
by an increase in management services partially offset by
reduced equipment sales and related network integration.
Governmental profes sional services revenue decreased
$116 in 2009 driven by the divestiture of a professional
services business in 2009 and increased $100 in 2008
driven by growth across various contracts.
Operations and support expenses decreased $794, or
1.7%, in 2009 and $737, or 1.6 %, in 2008. Operations and
support expenses consist of costs incurred to provide our
products and services, including costs of operating and
maintaining our networks and personnel costs, such as salary,
wage and bonus accruals. Costs in this category include our
repair technicians and repair services, certain network
planning and engineering expenses, operator services,
information technology and property taxes. Operations and
support expenses also include bad debt expense; advertising
costs; sales and marketing functions, including customer
service centers; real estate costs, including maintenance and