AT&T Wireless 2009 Annual Report Download - page 90
Download and view the complete annual report
Please find page 90 of the 2009 AT&T Wireless annual report below. You can navigate through the pages in the report by either clicking on the pages listed below, or by using the keyword search tool below to find specific information within the annual report.-
 1
1 -
2
-
3
-
4
-
5
-
6
-
7
-
8
-
9
-
10
-
11
-
12
-
13
-
14
-
15
-
16
-
17
-
18
-
19
-
20
-
21
-
22
-
23
-
24
-
25
-
26
-
27
-
28
-
29
-
30
-
31
-
32
-
33
-
34
-
35
-
36
-
37
-
38
-
39
-
40
-
41
-
42
-
43
-
44
-
45
-
46
-
47
-
48
-
49
-
50
-
51
-
52
-
53
-
54
-
55
-
56
-
57
-
58
-
59
-
60
-
61
-
62
-
63
-
64
-
65
-
66
-
67
-
68
-
69
-
70
-
71
-
72
-
73
-
74
-
75
-
76
-
77
-
78
-
79
-
 80
80 -
 81
81 -
 82
82 -
 83
83 -
 84
84 -
 85
85 -
 86
86 -
 87
87 -
 88
88 -
 89
89 -
 90
90 -
 91
91 -
 92
92 -
 93
93 -
 94
94 -
 95
95 -
 96
96 -
 97
97 -
 98
98 -
 99
99 -
 100
100
 |
 |

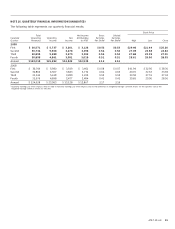
Notes to Consolidated Financial Statements (continued)
Dollars in millions except per share amounts
88 AT&T 09 AR
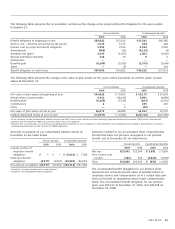
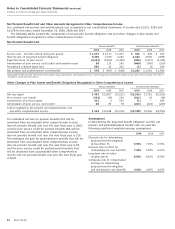
The following tables present the components of net periodic
benefit cost and other changes in plan assets and benefit
obligations recognized in other comprehensive income:
Net Periodic Benefit Cost 2009 2008
Service cost – benefits earned
during the period $ 22 $ 25
Interest cost on projected
benefit obligation 47 54
Expected return on assets (58) (60)
Amortization of actuarial (gain) (17) (5)
Net pension cost $ (6) $ 14
Other Changes Recognized in
Other Comprehensive Income 2009 2008
Net loss (gain) $75 $70
Amortization of net loss (gain) (8) (2)
Amortization of prior service cost — —
Total recognized in net pension cost
and other comprehensive income $67 $68
The estimated net loss that will be amortized from accumulated
other comprehensive income into net periodic benefit cost over
the next fiscal year is $1.
Contributory Savings Plans
We maintain contributory savings plans that cover substantially
all employees. Under the savings plans, we match in cash
or company stock a stated percentage of eligible employee
contributions, subject to a specified ceiling. There are no
debt-financed shares held by the Employee Stock Ownership
Plans, allocated or unallocated.
Our match of employee contributions to the savings
plans is fulfilled with purchases of our stock on the open
market or company cash. Benefit cost is based on the cost
of shares or units allocated to participating employees’
accounts and was $586, $664 and $633 for the years ended
December31,2009, 2008 and 2007.
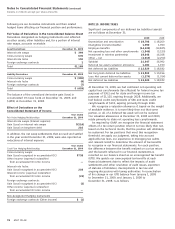
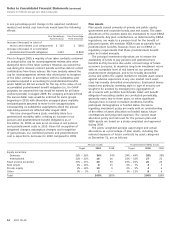
NOTE 12. SHARE-BASED PAYMENT
We account for our share-based payment arrangements using
GAAP standards for share-based awards. Our accounting
under these standards may affect our ability to fully realize
the value shown on our consolidated balance sheets of
deferred tax assets associated with compensation expense.
Full realization of these deferred tax assets requires stock
options to be exercised at a price equaling or exceeding the
sum of the exercise price plus the fair value of the options at
the grant date. The provisions of GAAP standards for share-
based awards do not allow a valuation allowance to be
recorded unless our future taxable income is expected to be
insufficient to recover the asset. Accordingly, there can be no
assurance that the current stock price of our common shares
will rise to levels sufficient to realize the entire tax benefit
currently reflected in our consolidated balance sheets.
The estimated net loss for our supplemental retirement plan
benefits that will be amortized from accumulated other
comprehensive income into net periodic benefit cost over
the next fiscal year is $16, and the prior service cost for our
supplemental retirement plan benefits that will be amortized
from accumulated other comprehensive income into net
periodic benefit cost over the next fiscal year is $2.
Deferred compensation expense was $95 in 2009, $54 in
2008 and $106 in 2007. Our deferred compensation liability,
included in “Other noncurrent liabilities,” was $1,031 at
December 31, 2009, and $1,054 at December 31, 2008.
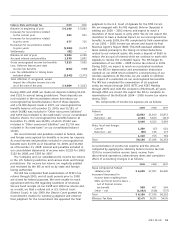
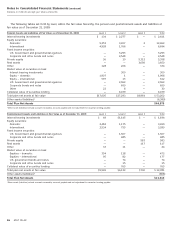
Non-U.S. Plans
As part of our ATTC acquisition, we acquired certain non-U.S.
operations that have varying types of pension programs
providing benefits for substantially all of their employees and,
to a limited group, postemployment benefits. The net amounts
recorded as “Postemployment benefit obligation” on our
consolidated balance sheets at December 31, 2009 and 2008,
were $(9) and $(7).
2009 2008
Benefit obligations at end of year $(1,040) $(786)
Fair value of plan assets 1,049 793
Funded status at end of year $ 9 $ 7
The following table provides information for certain non-U.S.
defined-benefit pension plans with plan assets in excess of
accumulated benefit obligations:
2009 2008
Projected benefit obligation $1,040 $786
Accumulated benefit obligation 975 700
Fair value of plan assets 1,049 793
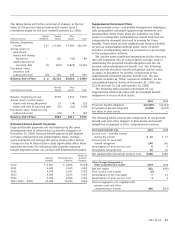
Our International Pension Assets are composed of Level 1
and Level 2 assets. Level 2 assets are primarily made up
of corporate bonds, notes and real assets totaling $688.
The remaining assets at fair value are Level 1 assets totaling
$361, related to equity investments and cash.
In determining the projected benefit obligation for certain
non-U.S. defined-benefit pension plans, we use assumptions
based upon interest rates relative to each country in which we
sponsor a plan. Additionally, the expected return is based on
the investment mix relative to each plan’s assets. Following
are the significant weighted-average assumptions:
2009 2008
Discount rate for determining projected
benefit obligation at December 31 5.16% 6.20%
Discount rate in effect for determining
net cost (benefit) 6.20% 5.57%
Long-term rate of return on plan assets 6.24% 6.13%
Composite rate of compensation increase
for determining projected benefit
obligation at December 31 3.99% 4.06%
Composite rate of compensation increase
for determining net pension cost 4.06% 4.25%