AT&T Wireless 2009 Annual Report Download - page 89
Download and view the complete annual report
Please find page 89 of the 2009 AT&T Wireless annual report below. You can navigate through the pages in the report by either clicking on the pages listed below, or by using the keyword search tool below to find specific information within the annual report.-
 1
1 -
2
-
3
-
4
-
5
-
6
-
7
-
8
-
9
-
10
-
11
-
12
-
13
-
14
-
15
-
16
-
17
-
18
-
19
-
20
-
21
-
22
-
23
-
24
-
25
-
26
-
27
-
28
-
29
-
30
-
31
-
32
-
33
-
34
-
35
-
36
-
37
-
38
-
39
-
40
-
41
-
42
-
43
-
44
-
45
-
46
-
47
-
48
-
49
-
50
-
51
-
52
-
53
-
54
-
55
-
56
-
57
-
58
-
59
-
60
-
61
-
62
-
63
-
64
-
65
-
66
-
67
-
68
-
69
-
70
-
71
-
72
-
73
-
74
-
75
-
76
-
77
-
78
-
 79
79 -
 80
80 -
 81
81 -
 82
82 -
 83
83 -
 84
84 -
 85
85 -
 86
86 -
 87
87 -
 88
88 -
 89
89 -
 90
90 -
 91
91 -
 92
92 -
 93
93 -
 94
94 -
 95
95 -
 96
96 -
 97
97 -
 98
98 -
 99
99 -
100
 |
 |

AT&T 09 AR 87
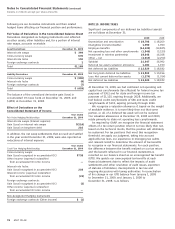
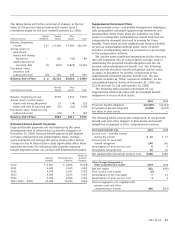
Supplemental Retirement Plans
We also provide senior- and middle-management employees
with nonqualified, unfunded supplemental retirement and
savings plans. While these plans are unfunded, we have
assets in a designated nonbankruptcy remote trust that are
independently managed and used to provide for these
benefits. These plans include supplemental pension benefits
as well as compensation-deferral plans, some of which
include a corresponding match by us based on a percentage
of the compensation deferral.
We use the same significant assumptions for the discount
rate and composite rate of compensation increase used in
determining the projected benefit obligation and the net
pension and postemployment benefit cost. The following
tables provide the plans’ benefit obligations and fair value
of assets at December 31 and the components of the
supplemental retirement pension benefit cost. The net
amounts recorded as “Other noncurrent liabilities” on our
consolidated balance sheets at December31, 2009, was
$2,139 and was $2,114 at December31, 2008.
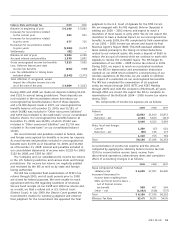
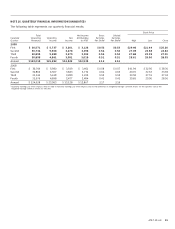
The following table provides information for our
supplemental retirement plans with accumulated benefit
obligations in excess of plan assets:
2009 2008
Projected benefit obligation $(2,139) $(2,114)
Accumulated benefit obligation (2,058) (2,023)
Fair value of plan assets — —
The following tables present the components of net periodic
benefit cost and other changes in plan assets and benefit
obligations recognized in other comprehensive income:
Net Periodic Benefit Cost 2009 2008
Service cost – benefits earned
during the period $ 11 $ 13
Interest cost on projected
benefit obligation 140 141
Amortization of prior service cost 5 6
Recognized actuarial loss 10 21
Net supplemental retirement pension cost $166 $181
Other Changes Recognized in
Other Comprehensive Income 2009 2008
Net loss (gain) $51 $(66)
Prior service cost (credit) (5) —
Amortization of net loss (gain) 7 11
Amortization of prior service cost 3 4
Total recognized in net supplemental
pension cost and other
comprehensive income $56 $(51)
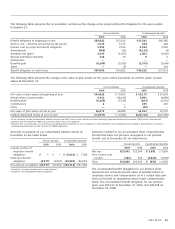
The tables below set forth a summary of changes in the fair
value of the pension and postretirement assets Level 3
investment assets for the year ended December 31, 2009:
Equity- Private Real
Pension Assets Domestic Equity Assets Total
Balance, beginning
of year $ 21 $ 5,494 $ 5,281 $10,796
Actual return on
plan assets:
Assets sold during
the period — 130 (41) 89
Assets still held at
reporting date 10 (652) (1,829) (2,471)
Purchases, sales,
issuances and
settlements (net) (29) 340 239 550
Balance, End of Year $ 2 $5,312 $3,650 $ 8,964
Private Real
Postretirement Assets Equity Assets Total
Balance, beginning of year $ 669 $ 210 $ 879
Actual return on plan assets:
Assets sold during the period 23 (34) (11)
Assets still held at reporting date (76) (62) (138)
Purchases, sales, issuances and
settlements (net) (33) 3 (30)
Balance, End of Year $583 $117 $ 700
Estimated Future Benefit Payments
Expected benefit payments are estimated using the same
assumptions used in determining our benefit obligation at
December 31, 2009. Because benefit payments will depend
on future employment and compensation levels, average
years employed and average life spans, among other factors,
changes in any of these factors could significantly affect these
expected amounts. The following table provides expected
benefit payments under our pension and postretirement plans:
Medicare
Pension Postretirement Subsidy
Benefits Benefits Receipts
2010 $ 4,897 $ 2,836 $(113)
2011 4,605 2,665 (121)
2012 4,578 2,627 (132)
2013 4,504 2,615 (143)
2014 4,432 2,596 (154)
Years 2015 – 2019 21,449 12,729 (944)