AT&T Wireless 2009 Annual Report Download - page 32
Download and view the complete annual report
Please find page 32 of the 2009 AT&T Wireless annual report below. You can navigate through the pages in the report by either clicking on the pages listed below, or by using the keyword search tool below to find specific information within the annual report.-
 1
1 -
2
-
3
-
4
-
5
-
6
-
7
-
8
-
9
-
10
-
11
-
12
-
13
-
14
-
15
-
16
-
17
-
18
-
19
-
20
-
21
-
 22
22 -
 23
23 -
 24
24 -
 25
25 -
 26
26 -
 27
27 -
 28
28 -
 29
29 -
 30
30 -
 31
31 -
 32
32 -
 33
33 -
 34
34 -
 35
35 -
 36
36 -
 37
37 -
 38
38 -
 39
39 -
 40
40 -
 41
41 -
 42
42 -
43
-
44
-
45
-
46
-
47
-
48
-
49
-
50
-
51
-
52
-
53
-
54
-
55
-
56
-
57
-
58
-
59
-
60
-
61
-
62
-
63
-
64
-
65
-
66
-
67
-
68
-
69
-
70
-
71
-
72
-
73
-
74
-
75
-
76
-
77
-
78
-
79
-
80
-
81
-
82
-
83
-
84
-
85
-
86
-
87
-
88
-
89
-
90
-
91
-
92
-
93
-
94
-
95
-
96
-
97
-
98
-
99
-
100
 |
 |

30 AT&T 09 AR
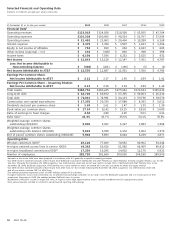
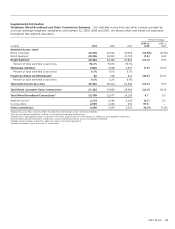
Selected Financial and Operating Data
Dollars in millions except per share amounts
At December 31 or for the year ended: 2009 2008 2007 20062 20053
Financial Data1
Operating revenues $123,018 $124,028 $118,928 $ 63,055 $ 43,764
Operating expenses $101,526 $100,965 $ 98,524 $ 52,767 $ 37,596
Operating income $ 21,492 $ 23,063 $ 20,404 $ 10,288 $ 6,168
Interest expense $ 3,379 $ 3,390 $ 3,507 $ 1,843 $ 1,456
Equity in net income of affiliates $ 734 $ 819 $ 692 $ 2,043 $ 609
Other income (expense) – net $ 152 $ (328) $ 810 $ 398 $ 398
Income taxes $ 6,156 $ 7,036 $ 6,252 $ 3,525 $ 932
Net Income $ 12,843 $ 13,128 $ 12,147 $ 7,361 $ 4,787
Less: Net Income Attributable to
Noncontrolling Interest $ (308) $ (261) $ (196) $ (5) $ (1)
Net Income Attributable to AT&T $ 12,535 $ 12,867 $ 11,951 $ 7,356 $ 4,786
Earnings Per Common Share:
Net Income Attributable to AT&T $ 2.12 $ 2.17 $ 1.95 $ 1.89 $ 1.42
Earnings Per Common Share – Assuming Dilution:
Net Income Attributable to AT&T $ 2.12 $ 2.16 $ 1.94 $ 1.89 $ 1.42
Total assets $268,752 $265,245 $275,644 $270,634 $145,632
Long-term debt $ 64,720 $ 60,872 $ 57,255 $ 50,063 $ 26,115
Total debt $ 72,081 $ 74,991 $ 64,115 $ 59,796 $ 30,570
Construction and capital expenditures $ 17,335 $ 20,335 $ 17,888 $ 8,393 $ 5,612
Dividends declared per common share $ 1.65 $ 1.61 $ 1.47 $ 1.35 $ 1.30
Book value per common share $ 17.34 $ 16.42 $ 19.15 $ 18.58 $ 14.09
Ratio of earnings to fixed charges 4.50 4.80 4.95 5.01 4.11
Debt ratio7 41.3% 43.7% 35.6% 34.1% 35.9%
Weighted-average common shares
outstanding (000,000) 5,900 5,927 6,127 3,882 3,368
Weighted-average common shares
outstanding with dilution (000,000) 5,924 5,958 6,170 3,902 3,379
End of period common shares outstanding (000,000) 5,902 5,893 6,044 6,239 3,877
Operating Data
Wireless customers (000)4 85,120 77,009 70,052 60,962 54,144
In-region network access lines in service (000)5 49,392 55,610 61,582 66,469 49,413
In-region broadband connections (000)6,7 17,254 16,265 14,802 12,170 6,921
Number of employees 282,720 302,660 309,050 304,180 189,950
1 Amounts in the above table have been prepared in accordance with U.S. generally accepted accounting principles.
2 Our 2006 income statement amounts reflect results from BellSouth Corporation (BellSouth) and AT&T Mobility LLC (AT&T Mobility), formerly Cingular Wireless LLC, for the
two days following the December 29, 2006 acquisition. Our 2006 balance sheet and end-of-year metrics include 100% of BellSouth and AT&T Mobility. Prior to the
December 29, 2006, BellSouth acquisition, AT&T Mobility was a joint venture in which we owned 60% and was accounted for under the equity method.
3 Our 2005 income statement amounts reflect results from AT&T Corp. for the 43 days following the November 18, 2005, acquisition. Our 2005 balance sheet and
end-of-year metrics include 100% of AT&T Corp.
4 The number presented represents 100% of AT&T Mobility cellular/PCS customers.
5 In-region represents access lines serviced by our incumbent local exchange companies (in 22 states since the BellSouth acquisition and in 13 states prior to that
acquisition). Beginning in 2006, the number includes BellSouth lines in service.
6 Broadband connections include in-region DSL lines, in-region U-verse High Speed Internet access, satellite broadband and 3G LaptopConnect cards.
7 Prior period amounts restated to conform to current period reporting methodology.