AT&T Wireless 2009 Annual Report Download - page 39
Download and view the complete annual report
Please find page 39 of the 2009 AT&T Wireless annual report below. You can navigate through the pages in the report by either clicking on the pages listed below, or by using the keyword search tool below to find specific information within the annual report.-
 1
1 -
2
-
3
-
4
-
5
-
6
-
7
-
8
-
9
-
10
-
11
-
12
-
13
-
14
-
15
-
16
-
17
-
18
-
19
-
20
-
21
-
22
-
23
-
24
-
25
-
26
-
27
-
28
-
 29
29 -
 30
30 -
 31
31 -
 32
32 -
 33
33 -
 34
34 -
 35
35 -
 36
36 -
 37
37 -
 38
38 -
 39
39 -
 40
40 -
 41
41 -
 42
42 -
 43
43 -
 44
44 -
 45
45 -
 46
46 -
 47
47 -
 48
48 -
 49
49 -
50
-
51
-
52
-
53
-
54
-
55
-
56
-
57
-
58
-
59
-
60
-
61
-
62
-
63
-
64
-
65
-
66
-
67
-
68
-
69
-
70
-
71
-
72
-
73
-
74
-
75
-
76
-
77
-
78
-
79
-
80
-
81
-
82
-
83
-
84
-
85
-
86
-
87
-
88
-
89
-
90
-
91
-
92
-
93
-
94
-
95
-
96
-
97
-
98
-
99
-
100
 |
 |

AT&T 09 AR 37
•Localvoicerevenuesdecreased$2,763,or12.2%,in
2009anddecreased$1,887,or7.7%,in2008.The
decreasein2009wasdrivenprimarilybyan11.2%
declineinswitchedaccesslinesandadecreasein
averagelocalvoicerevenueperuser.Thedecrease
in2008wasdrivenprimarilybyalossofrevenueof
$1,230fromadeclineinaccesslinesandby$422
fromadeclineinournationalmass-marketcustomer
baseacquiredfromAT&TCorp.(ATTC).Weexpectour
localvoicerevenuetocontinuetobenegatively
affectedbyincreasedcompetitionfromalternative
technologies,thedisconnectionofadditionallines
andeconomicpressures.
• Long-distancerevenuesdecreased$2,133,or15.3%,in
2009anddecreased$1,195,or7.9%,in2008primarily
duetodecreaseddemandfrombusinessandconsumer
customers,whichdecreasedrevenues$1,583in2009
and$532in2008,andanetdecreaseindemandfor
long-distanceservice,duetoexpecteddeclinesinthe
numberofnationalmass-marketcustomers,which
decreasedrevenues$546in2009and$677in2008.
Datarevenuesincreased$1,370,or5.4%,in2009and
increased$1,278,or5.3%,in2008.Datarevenuesaccounted
forapproximately41%ofwirelineoperatingrevenuesin2009,
36%in2008and34%in2007.Datarevenuesincludetransport,
IPandpacket-switcheddataservices.
Operating Margin Trends
OurWirelinesegmentoperatingincomemarginwas12.1%
in2009,comparedto16.0%in2008and16.7%in2007.
Resultsfor2009and2008reflectrevenuedeclinesthat
exceededexpensedeclines.OurWirelinesegmentoperating
incomedecreased$3,278,or29.2%,in2009anddecreased
$781,or6.5%,in2008.Ouroperatingincomecontinued
tobepressuredbyaccesslinedeclinesduetoeconomic
pressuresonourconsumerandbusinesswirelinecustomers
andcompetition,ascustomerseitherreducedusageor
discon
nectedtraditionallandlineservicesandswitched
toalternativetechnologies,suchaswirelessandVoIP.
Ourstrategyistooffsettheselinelossesbyincreasing
non-access-line-relatedrevenuesfromcustomerconnections
fordata,videoandvoice.Additionally,wehavethe
opportunitytoincreaseWirelesssegmentrevenuesif
customerschooseAT&TMobilityasanalternativeprovider.
Wirelineoperatingmarginsaredecliningprimarilydueto
reducedvoicerevenue,partiallyoffsetbycontinuedgrowthin
datarevenue.Alsocontributingtopressureonouroperating
marginswasincreasedpension/OPEBexpensein2009.
Voicerevenuesdecreased$5,116,or13.4%,in2009,
anddecreased$3,432,or8.2%,in2008primarilydueto
continuingeconomicpressuresanddecliningdemandfor
traditionalvoiceandotherlegacyservicesbyourconsumer
andbusinesscustomers.Includedinvoicerevenuesare
revenuesfromlocalvoice,long-distanceandlocalwholesale
services.VoicerevenuesdonotincludeVoIPrevenues,which
areincludedindatarevenues.
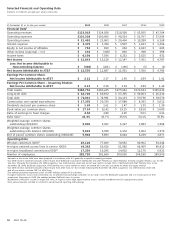
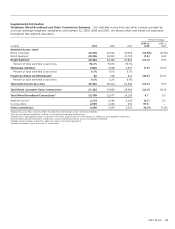
Wireline
Segment Results
PercentChange
2009 vs. 2008vs.
2009 2008 2007 2008 2007
Segmentoperatingrevenues
Voice $33,082 $38,198 $41,630 (13.4)% (8.2)%
Data 26,723 25,353 24,075 5.4 5.3
Other 5,865 6,304 5,878 (7.0) 7.2
TotalSegmentOperatingRevenues 65,670 69,855 71,583 (6.0) (2.4)
Segmentoperatingexpenses
Operationsandsupport 44,646 45,440 46,177 (1.7) (1.6)
Depreciationandamortization 13,093 13,206 13,416 (0.9) (1.6)
TotalSegmentOperatingExpenses 57,739 58,646 59,593 (1.5) (1.6)
SegmentOperatingIncome 7,931 11,209 11,990 (29.2) (6.5)
EquityinNetIncomeofAffiliates 18 19 31 (5.3) (38.7)
SegmentIncome $ 7,949 $11,228 $12,021 (29.2)% (6.6)%