AT&T Wireless 2009 Annual Report Download - page 63
Download and view the complete annual report
Please find page 63 of the 2009 AT&T Wireless annual report below. You can navigate through the pages in the report by either clicking on the pages listed below, or by using the keyword search tool below to find specific information within the annual report.-
 1
1 -
2
-
3
-
4
-
5
-
6
-
7
-
8
-
9
-
10
-
11
-
12
-
13
-
14
-
15
-
16
-
17
-
18
-
19
-
20
-
21
-
22
-
23
-
24
-
25
-
26
-
27
-
28
-
29
-
30
-
31
-
32
-
33
-
34
-
35
-
36
-
37
-
38
-
39
-
40
-
41
-
42
-
43
-
44
-
45
-
46
-
47
-
48
-
49
-
50
-
51
-
52
-
 53
53 -
 54
54 -
 55
55 -
 56
56 -
 57
57 -
 58
58 -
 59
59 -
 60
60 -
 61
61 -
 62
62 -
 63
63 -
 64
64 -
 65
65 -
 66
66 -
 67
67 -
 68
68 -
 69
69 -
 70
70 -
 71
71 -
 72
72 -
 73
73 -
74
-
75
-
76
-
77
-
78
-
79
-
80
-
81
-
82
-
83
-
84
-
85
-
86
-
87
-
88
-
89
-
90
-
91
-
92
-
93
-
94
-
95
-
96
-
97
-
98
-
99
-
100
 |
 |

AT&T 09 AR 61
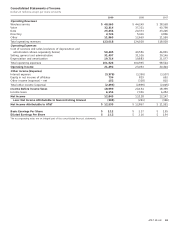
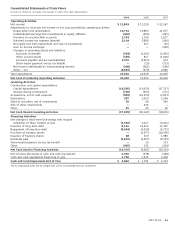
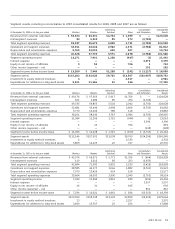
Consolidated Statements of Cash Flows
Dollars in millions, increase (decrease) in cash and cash equivalents
2009 2008 2007
Operating Activities
Net income $ 12,843 $ 13,128 $ 12,147
Adjustments to reconcile net income to net cash provided by operating activities:
Depreciation and amortization 19,714 19,883 21,577
Undistributed earnings from investments in equity affiliates (419) (654) (297)
Provision for uncollectible accounts 1,763 1,796 1,617
Deferred income tax expense (benefit) 2,104 5,889 (240)
Net (gain) loss from impairment and sale of investments — 517 (11)
Gain on license exchange — — (409)
Changes in operating assets and liabilities:
Accounts receivable (454) (1,421) (1,491)
Other current assets (355) 827 (1,020)
Accounts payable and accrued liabilities 2,372 (5,563) 672
Share-based payment excess tax benefit — (15) (173)
Net income attributable to noncontrolling interest (308) (261) (196)
Other – net (2,815) (470) 2,066
Total adjustments 21,602 20,528 22,095
Net Cash Provided by Operating Activities 34,445 33,656 34,242
Investing Activities
Construction and capital expenditures:
Capital expenditures (16,595) (19,676) (17,717)
Interest during construction (740) (659) (171)
Acquisitions, net of cash acquired (983) (10,972) (2,873)
Dispositions 287 1,615 1,594
Sales of securities, net of investments 55 68 455
Sale of other investments — 436 —
Other 51 45 36
Net Cash Used in Investing Activities (17,925) (29,143) (18,676)
Financing Activities
Net change in short-term borrowings with original
maturities of three months or less (3,910) 2,017 (3,411)
Issuance of long-term debt 8,161 12,416 11,367
Repayment of long-term debt (8,654) (4,010) (6,772)
Purchase of treasury shares — (6,077) (10,390)
Issuance of treasury shares 28 319 1,986
Dividends paid (9,670) (9,507) (8,743)
Share-based payment excess tax benefit — 15 173
Other (465) 136 (224)
Net Cash Used in Financing Activities (14,510) (4,691) (16,014)
Net increase (decrease) in cash and cash equivalents 2,010 (178) (448)
Cash and cash equivalents beginning of year 1,792 1,970 2,418
Cash and Cash Equivalents End of Year $ 3,802 $ 1,792 $ 1,970
The accompanying notes are an integral part of the consolidated financial statements.