AT&T Wireless 2009 Annual Report Download - page 41
Download and view the complete annual report
Please find page 41 of the 2009 AT&T Wireless annual report below. You can navigate through the pages in the report by either clicking on the pages listed below, or by using the keyword search tool below to find specific information within the annual report.-
 1
1 -
2
-
3
-
4
-
5
-
6
-
7
-
8
-
9
-
10
-
11
-
12
-
13
-
14
-
15
-
16
-
17
-
18
-
19
-
20
-
21
-
22
-
23
-
24
-
25
-
26
-
27
-
28
-
29
-
30
-
 31
31 -
 32
32 -
 33
33 -
 34
34 -
 35
35 -
 36
36 -
 37
37 -
 38
38 -
 39
39 -
 40
40 -
 41
41 -
 42
42 -
 43
43 -
 44
44 -
 45
45 -
 46
46 -
 47
47 -
 48
48 -
 49
49 -
 50
50 -
 51
51 -
52
-
53
-
54
-
55
-
56
-
57
-
58
-
59
-
60
-
61
-
62
-
63
-
64
-
65
-
66
-
67
-
68
-
69
-
70
-
71
-
72
-
73
-
74
-
75
-
76
-
77
-
78
-
79
-
80
-
81
-
82
-
83
-
84
-
85
-
86
-
87
-
88
-
89
-
90
-
91
-
92
-
93
-
94
-
95
-
96
-
97
-
98
-
99
-
100
 |
 |

AT&T 09 AR 39
Supplemental Information
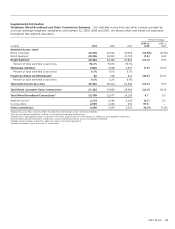
Telephone, Wired Broadband and Video Connections Summary Our switched access lines and other services provided by
our local exchange telephone subsidiaries at December 31, 2009, 2008 and 2007, are shown below and trends are addressed
throughout this segment discussion.
Percent Change
2009 vs. 2008 vs.
(in 000s) 2009 2008 2007 2008 2007
Switched Access Lines1
Retail consumer 26,378 30,614 35,009 (13.8)% (12.6)%
Retail business2 20,106 21,810 22,795 (7.8) (4.3)
Retail Subtotal2 46,484 52,424 57,804 (11.3) (9.3)
Percent of total switched access lines 94.1% 94.3% 93.9%
Wholesale Subtotal2 2,826 3,068 3,527 (7.9) (13.0)
Percent of total switched access lines 5.7% 5.5% 5.7%
Payphone (Retail and Wholesale)3 82 118 251 (30.5) (53.0)
Percent of total switched access lines 0.2% 0.2% 0.4%
Total Switched Access Lines 49,392 55,610 61,582 (11.2) (9.7)
Total Retail Consumer Voice Connections6 27,332 30,838 35,009 (11.4) (11.9)
Total Wired Broadband Connections4 15,789 15,077 14,156 4.7 6.5
Satellite service5 2,174 2,190 2,116 (0.7) 3.5
U-verse video 2,065 1,045 231 97.6 —
Video Connections 4,239 3,235 2,347 31.0% 37.8%
1Represents access lines served by AT&T’s Incumbent Local Exchange Carriers (ILECs) and affiliates.
2Prior period amounts restated to conform to current period reporting methodology.
3Revenue from retail payphone lines is reported in the Other segment. We are in the process of ending our retail payphone operations.
4Total wired broadband connections include DSL, U-verse High Speed Internet access and satellite broadband.
5Satellite service includes connections under our agency and resale agreements.
6Includes consumer U-verse Voice over IP connections.