THQ 2012 Annual Report Download - page 97
Download and view the complete annual report
Please find page 97 of the 2012 THQ annual report below. You can navigate through the pages in the report by either clicking on the pages listed below, or by using the keyword search tool below to find specific information within the annual report.-
 1
1 -
2
-
3
-
4
-
5
-
6
-
7
-
8
-
9
-
10
-
11
-
12
-
13
-
14
-
15
-
16
-
17
-
18
-
19
-
20
-
21
-
22
-
23
-
24
-
25
-
26
-
27
-
28
-
29
-
30
-
31
-
32
-
33
-
34
-
35
-
36
-
37
-
38
-
39
-
40
-
41
-
42
-
43
-
44
-
45
-
46
-
47
-
48
-
49
-
50
-
51
-
52
-
53
-
54
-
55
-
56
-
57
-
58
-
59
-
60
-
61
-
62
-
63
-
64
-
65
-
66
-
67
-
68
-
69
-
70
-
71
-
72
-
73
-
74
-
75
-
76
-
77
-
78
-
79
-
80
-
81
-
82
-
83
-
84
-
85
-
86
-
 87
87 -
 88
88 -
 89
89 -
 90
90 -
 91
91 -
 92
92 -
 93
93 -
 94
94 -
 95
95 -
 96
96 -
 97
97 -
 98
98 -
 99
99 -
 100
100
 |
 |

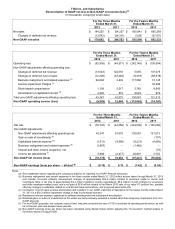
THQ Inc. and Subsidiaries
Reconciliation of GAAP net loss to Non-GAAP net income (loss) (a)
(In thousands, except per share data)
For the Three Months
Ended March 31,
For the Twelve Months
Ended March 31,
2012 2011 2012 2011
Net sales $ 184,235 $ 124,237
$ 830,841 $ 665,258
Chan
g
es in deferred net revenue
(
13,543
)
124,316
5,055 137,075
Non-GAAP net sales $ 170,692 $ 248,553
$ 835,896 $ 802,333
For the Three Months
Ended March 31,
For the Twelve Months
Ended March 31,
2012 2011 2012 2011
Operatin
g
loss $
(
52,906
)
$
(
49,571
)
$
(
242,149
)
$
(
135,694
)
Non-GAAP ad
j
ustments affectin
g
operatin
g
loss:
Chan
g
es in deferred net revenue
(
13,543
)
124,316
5,055 137,075
Chan
g
es in deferred cost of sales
(
12,206
)
(
67,262
)
(
6,318
)
(
68,518
)
Business reali
g
nment and related expenses (b) 64,694 2,232
117,566 13,145
License impairment char
g
es (c)
—
—
—
30,296
Stock-based compensation 1,109 2,017
5,762 8,843
Amortization of capitalized interest (d) 3,293 672
8,022 672
Total non-GAAP ad
j
ustments affectin
g
operatin
g
loss 43,347 61,975
130,087 121,513
Non-GAAP operatin
g
income
(
loss
)
$
(
9,559
)
$ 12,404
$
(
112,062
)
$
(
14,181
)
For the Three Months
Ended March 31,
For the Twelve Months
Ended March 31,
2012 2011 2012 2011
Net loss $
(
55,797
)
$
(
44,056
)
$
(
242,506
)
$
(
136,098
)
Non-GAAP ad
j
ustments:
Non-GAAP ad
j
ustments affectin
g
operatin
g
loss 43,347 61,975
130,087 121,513
Gain on sale of investments (e)
—
—
—
(
107
)
Capitalized interest expense (d)
(
1,511
)
(
4,990
)
(
6,231
)
(
4,990
)
Business reali
g
nment and related expenses (b)
(
1,897
)
—
(
1,462
)
—
Interest and other income
(
expense
)
, net
—
—
—
(
72
)
Income tax ad
j
ustments (f) 5,684
(
2,477
)
22,691 3,752
Non-GAAP net income
(
loss
)
$
(
10,174
)
$ 10,452
$
(
97,421
)
$
(
16,002
)
Non-GAAP earnin
g
s
(
loss
)
per share
—
diluted (g) $
(
0.15
)
$ 0.15
$
(
1.42
)
$
(
0.24
)
___________________
Notes:
(a) See explanation above regarding the company's practice on reporting non-GAAP financial measures.
(b) Business realignment and related expenses in the three months ended March 31, 2012 reflect actions taken through March 31, 2012
and include: non-cash software development charges of approximately $52.6 million related to decisions made to cancel and
reconfigure titles; a net loss of approximately $2.4 million related to license negotiations; $8.4 million of cash charges for severance
and other employee-related costs; and a net gain of $0.6 million related to the March 2012 sale of our value PC product line, partially
offset by changes in estimates related to contract and lease terminations, and long-lived asset write-offs.
(c) Included in "Cost of sales-License amortization and royalties" in our GAAP statement of operations for the twelve months ended March
31, 2011 is a $30.3 million impairment charge on kids movie-based licenses.
(d) Represents interest expense capitalized to software development and subsequent amortization.
(e) Realized gains on sales of investments to the extent we had previously excluded a related other-than-temporary impairment from non-
GAAP amounts.
(f) For non-GAAP purposes, the company uses a fixed, long-term projected tax rate of 15% to evaluate its operating performance, as well
as to forecast, plan and analyze future periods.
(g) Non-GAAP earnings (loss) per share has been calculated using diluted shares before applying the “if-converted” method relative to
the Notes issued in August 2009.