THQ 2012 Annual Report Download - page 62
Download and view the complete annual report
Please find page 62 of the 2012 THQ annual report below. You can navigate through the pages in the report by either clicking on the pages listed below, or by using the keyword search tool below to find specific information within the annual report.-
 1
1 -
2
-
3
-
4
-
5
-
6
-
7
-
8
-
9
-
10
-
11
-
12
-
13
-
14
-
15
-
16
-
17
-
18
-
19
-
20
-
21
-
22
-
23
-
24
-
25
-
26
-
27
-
28
-
29
-
30
-
31
-
32
-
33
-
34
-
35
-
36
-
37
-
38
-
39
-
40
-
41
-
42
-
43
-
44
-
45
-
46
-
47
-
48
-
49
-
50
-
51
-
 52
52 -
 53
53 -
 54
54 -
 55
55 -
 56
56 -
 57
57 -
 58
58 -
 59
59 -
 60
60 -
 61
61 -
 62
62 -
 63
63 -
 64
64 -
 65
65 -
 66
66 -
 67
67 -
 68
68 -
 69
69 -
 70
70 -
 71
71 -
 72
72 -
73
-
74
-
75
-
76
-
77
-
78
-
79
-
80
-
81
-
82
-
83
-
84
-
85
-
86
-
87
-
88
-
89
-
90
-
91
-
92
-
93
-
94
-
95
-
96
-
97
-
98
-
99
-
100
 |
 |

54
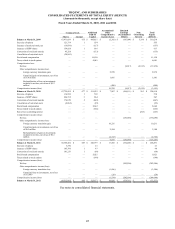
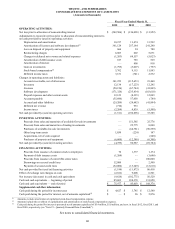
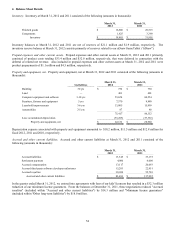
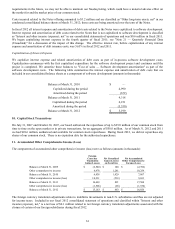
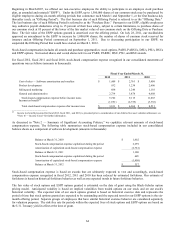
4. Balance Sheet Details
Inventory. Inventory at March 31, 2012 and 2011 consisted of the following (amounts in thousands):
March 31,
2012
March 31,
2011
Finished
g
oods $ 16,860 $ 28,515
Com
p
onents 1,625 3,390
Inventor
y
$ 18,485 $ 31,905
Inventory balances at March 31, 2012 and 2011 are net of reserves of $21.1 million and $1.9 million, respectively. The
inventory reserve balance at March 31, 2012 consists primarily of reserves related to our uDraw GameTablet ("uDraw").
Prepaid expenses and other current assets. Prepaid expenses and other current assets at March 31, 2012 and 2011 primarily
consisted of product costs totaling $33.4 million and $32.0 million, respectively, that were deferred in connection with the
deferral of related net revenue. Also included in prepaid expenses and other current assets at March 31, 2012 and 2011 were
product prepayments of $1.1 million and $4.5 million, respectively.
Property and equipment, net. Property and equipment, net at March 31, 2012 and 2011 consisted of the following (amounts in
thousands):
Useful lives
March 31,
2012
March 31,
2011
Buildin
g
30
y
rs $ 730 $ 730
Lan
d
—
401 401
Com
p
uter e
q
ui
p
ment and software 3-10
y
rs 53,624 60,254
Furniture, fixtures and e
q
ui
p
ment 5
y
rs 7,570 8,880
Leasehold im
p
rovements 3-6
y
rs 13,005 15,999
Automobiles 2-5
y
rs 87 88
75,417 86,352
Less: accumulated de
p
reciation
(
53,285
)
(
57,392
)
Pro
p
ert
y
and e
q
ui
p
ment, net $ 22,132 $ 28,960
Depreciation expense associated with property and equipment amounted to $10.2 million, $11.5 million and $12.8 million for
fiscal 2012, 2011 and 2010, respectively.
Accrued and other current liabilities. Accrued and other current liabilities at March 31, 2012 and 2011 consisted of the
following (amounts in thousands):
March 31,
2012
March 31,
2011
Accrued liabilities $ 13,345 $ 33,175
Settlement
p
a
y
ment 4,000 6,000
Accrued com
p
ensation 13,117 20,093
Accrued thir
d
-
p
art
y
software develo
p
er milestones 15,201 22,951
Accrued ro
y
alties 38,030 55,703
Accrued and other current liabilities $ 83,693 $ 137,922
In the quarter ended March 31, 2012, we entered into agreements with four of our kids' licensors that resulted in a $32.3 million
reduction of our minimum license guarantees. From the balances at December 31, 2011, these negotiations reduced "Accrued
royalties" (included within "Accrued and other current liabilities") by $14.3 million and "Minimum license guarantees"
(included within "Other long-term liabilities") by $18.0 million.