THQ 2012 Annual Report Download - page 73
Download and view the complete annual report
Please find page 73 of the 2012 THQ annual report below. You can navigate through the pages in the report by either clicking on the pages listed below, or by using the keyword search tool below to find specific information within the annual report.-
 1
1 -
2
-
3
-
4
-
5
-
6
-
7
-
8
-
9
-
10
-
11
-
12
-
13
-
14
-
15
-
16
-
17
-
18
-
19
-
20
-
21
-
22
-
23
-
24
-
25
-
26
-
27
-
28
-
29
-
30
-
31
-
32
-
33
-
34
-
35
-
36
-
37
-
38
-
39
-
40
-
41
-
42
-
43
-
44
-
45
-
46
-
47
-
48
-
49
-
50
-
51
-
52
-
53
-
54
-
55
-
56
-
57
-
58
-
59
-
60
-
61
-
62
-
 63
63 -
 64
64 -
 65
65 -
 66
66 -
 67
67 -
 68
68 -
 69
69 -
 70
70 -
 71
71 -
 72
72 -
 73
73 -
 74
74 -
 75
75 -
 76
76 -
 77
77 -
 78
78 -
 79
79 -
 80
80 -
 81
81 -
 82
82 -
 83
83 -
84
-
85
-
86
-
87
-
88
-
89
-
90
-
91
-
92
-
93
-
94
-
95
-
96
-
97
-
98
-
99
-
100
 |
 |

65
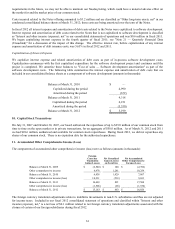
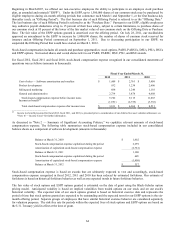
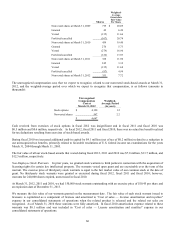
The weighted-average grant-date fair value of options granted during fiscal 2012, fiscal 2011 and fiscal 2010 was $1.40, $2.42,
and $2.77, respectively, and were based on the weighted-average assumptions noted in the table below.
Fiscal Year Ended March 31,
2012 2011 2010
Dividend
y
iel
d
—
%
—
%
—
%
Antici
p
ated volatilit
y
72.4% 71.1% 65.6%
Wei
g
hte
d
-avera
g
e ris
k
-free interest rate 0.7% 1.0% 1.5%
Ex
p
ected lives 3.0
y
ears 3.0
y
ears 3.0
y
ears
The fair value of our ESPP options for the six-month offering periods that began on September 1, 2011, September 1, 2010,
March 1, 2010 and September 1, 2009, was estimated using the Black-Scholes option pricing model with the weighted-average
assumptions noted in the table below, and the per share fair value for those offering periods was $0.55, $1.03, $1.62, and $1.89,
respectively.
Em
p
lo
y
ee Stock Purchase Plan
September 1,
2011
September 1,
2010
March 1,
2010
September 1,
2009
Dividend
y
iel
d
—
%
—
%
—
%
—
%
Antici
p
ated volatilit
y
60.6% 58.3% 48.1% 84.5%
Wei
g
hte
d
-avera
g
e ris
k
-free interest rate 0.1% 0.2% 0.2% 0.2%
Ex
p
ected lives 0.5
y
ears 0.5
y
ears 0.5
y
ears 0.5
y
ears
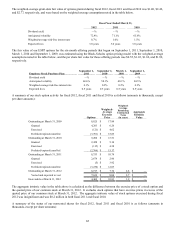
A summary of our stock option activity for fiscal 2012, fiscal 2011 and fiscal 2010 is as follows (amounts in thousands, except
per share amounts):
O
p
tions
Weighted-
Average
Exercise
Price
Weighted-
Average
Remaining
Contractual
Term
(in
y
ears)
Aggregate
Intrinsic
Value
Outstandin
g
at March 31, 2009 8,825 $ 17.84
Grante
d
4,203 $ 6.26
Exercise
d
(
121
)
$ 4.62
Forfeited/ex
p
ired/cancelle
d
(
3,701
)
$ 15.89
Outstandin
g
at March 31, 2010 9,206 $ 13.51
Grante
d
2,428 $ 5.14
Exercise
d
(
115
)
$ 4.38
Forfeited/ex
p
ired/cancelle
d
(
2,766
)
$ 15.17
Outstandin
g
at March 31, 2011 8,753 $ 10.78
Grante
d
2,679 $ 2.96
Exercise
d
(
5
)
$ 3.92
Forfeited/ex
p
ired/cancelle
d
(
3,230
)
$ 12.03
Outstandin
g
at March 31, 2012 8,197 $ 7.74 2.8 $
—
Vested and ex
p
ected to vest 7,639 $ 8.04 2.7 $
—
Exercisable at March 31, 2012 4,460 $ 10.83 1.9 $
—
The aggregate intrinsic value in the table above is calculated as the difference between the exercise price of a stock option and
the quoted price of our common stock at March 31, 2012. It excludes stock options that have exercise prices in excess of the
quoted price of our common stock at March 31, 2012. The aggregate intrinsic value of stock options exercised during fiscal
2012 was insignificant and was $0.2 million in both fiscal 2011 and fiscal 2010.
A summary of the status of our nonvested shares for fiscal 2012, fiscal 2011 and fiscal 2010 is as follows (amounts in
thousands, except per share amounts):