THQ 2012 Annual Report Download - page 41
Download and view the complete annual report
Please find page 41 of the 2012 THQ annual report below. You can navigate through the pages in the report by either clicking on the pages listed below, or by using the keyword search tool below to find specific information within the annual report.-
 1
1 -
2
-
3
-
4
-
5
-
6
-
7
-
8
-
9
-
10
-
11
-
12
-
13
-
14
-
15
-
16
-
17
-
18
-
19
-
20
-
21
-
22
-
23
-
24
-
25
-
26
-
27
-
28
-
29
-
30
-
 31
31 -
 32
32 -
 33
33 -
 34
34 -
 35
35 -
 36
36 -
 37
37 -
 38
38 -
 39
39 -
 40
40 -
 41
41 -
 42
42 -
 43
43 -
 44
44 -
 45
45 -
 46
46 -
 47
47 -
 48
48 -
 49
49 -
 50
50 -
 51
51 -
52
-
53
-
54
-
55
-
56
-
57
-
58
-
59
-
60
-
61
-
62
-
63
-
64
-
65
-
66
-
67
-
68
-
69
-
70
-
71
-
72
-
73
-
74
-
75
-
76
-
77
-
78
-
79
-
80
-
81
-
82
-
83
-
84
-
85
-
86
-
87
-
88
-
89
-
90
-
91
-
92
-
93
-
94
-
95
-
96
-
97
-
98
-
99
-
100
 |
 |

33
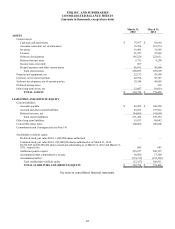
Liquidity and Capital Resources
Financial Condition
At March 31, 2012, we had working capital of $18.7 million, including cash and cash equivalents of $76.0 million. Included in
our working capital is a net reduction of $68.5 million related to the non-cash deferral of revenue, net of related expenses.
During our fiscal year 2012, we made a number of changes to our organization and product lineup. We discontinued a number
of titles in our product pipeline that did not fit our strategic objectives, thus reducing future product development expenses. We
reduced the number of internal development studios from eleven to five. We exited markets, sold or reconfigured games and
product lines that did not meet internal profitability thresholds or were no longer central to our go-forward strategy. We
negotiated with our kids' and movie-based licensors to reduce our future license commitments. We reduced costs and
headcount in our corporate and global publishing organizations as well as our studios impacted by the changes in our product
line-up. In January 2012, we implemented a plan of restructuring in order to better align our operating expenses with the lower
expected revenues under the updated strategy. In connection with this realignment, we significantly reduced other future
product development expenditures which did not align with our current strategy. The majority of the restructuring was
completed by March 31, 2012. We expect remaining severance amounts of $5.0 million to be paid by September 30, 2012.
These actions will have reduced headcount by approximately 370 people.
As a result of these strategic initiatives, we recorded charges affecting our operating loss totaling $117.6 million in fiscal 2012.
These realignment charges include $6.8 million of costs associated with lease abandonments, write-off of fixed assets, as well
as other non-cancellable contracts; non-cash charges of $74.7 million related to the write-off of capitalized software for games
that have been cancelled or reconfigured; non-cash charges of $18.4 million related to impairment of licenses in connection
with the cancelled games; and $17.8 million in cash charges related to severance and other employee benefits.
With our focused product plan, lower cost structure, cash balance, existing credit facility and other sources of external liquidity,
we believe we have adequate resources to execute on our plan and deliver on our strong multi-year pipeline of games. Although
we believe our current business plan is achievable, should we fail to achieve the sales, gross margin levels, and maintain the
vendor credit terms we anticipate, or if we were to incur significant unplanned cash outlays, it would become necessary for us
to obtain additional sources of liquidity or make further cost cuts (including future product development) to fund our
operations, which could result in additional restructuring and impairment charges. However, there is no assurance that we
would be able to obtain additional financing on favorable terms, if at all, or to successfully further reduce costs in such a way
that would continue to allow us to operate our business. If for any reason our projections do not materialize, we may not be
able to comply with the requirements of our credit facility as further discussed below. Our ability to achieve our business plan
and anticipated levels of liquidity could also be affected by various risks and uncertainties described in "Part I, Item 1A. Risk
Factors."
Sources and Uses of Cash
(
Amounts in thousands
)
March 31,
2012
March 31,
2011 Chan
g
e
Cash and cash e
q
uivalents $ 75,977 $ 85,603
$
(
9,626
)
Percenta
g
e of total assets 19% 11 %
Fiscal Year Ended March 31,
(
Amounts in thousands
)
2012 2011 Chan
g
e
Net cash used in o
p
eratin
g
activities $
(
1,511
)
$
(
196,898
)
$ 195,387
Net cash
p
rovided b
y
(
used in
)
investin
g
activities
(
4,759
)
96,987
(
101,746
)
Net cash used in financin
g
activities
(
1,194
)
(
11,872
)
10,678
Effect of exchan
g
e rate chan
g
es on cash
(
2,162
)
9,008
(
11,170
)
Net decrease in cash and cash e
q
uivalents $
(
9,626
)
$
(
102,775
)
$ 93,149
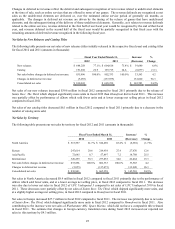
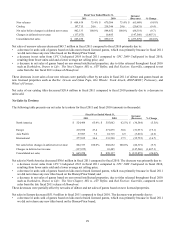
Generally, our primary sources of internal liquidity are cash and cash equivalents. In addition, as further discussed below, we
may elect to sell certain of our eligible North American accounts receivable and we have other external sources of liquidity
available to us, including our Credit Facility (as described below). Our principal source of cash is from sales of interactive
software games designed for play on video game consoles, handheld devices and PCs, including via the Internet. Our principal
uses of cash are for product purchases of discs and cartridges along with associated manufacturer's royalties, payments to
external developers and licensors, costs of internal software development, and selling and marketing expenses. In fiscal 2012