THQ 2012 Annual Report Download - page 33
Download and view the complete annual report
Please find page 33 of the 2012 THQ annual report below. You can navigate through the pages in the report by either clicking on the pages listed below, or by using the keyword search tool below to find specific information within the annual report.-
 1
1 -
2
-
3
-
4
-
5
-
6
-
7
-
8
-
9
-
10
-
11
-
12
-
13
-
14
-
15
-
16
-
17
-
18
-
19
-
20
-
21
-
22
-
 23
23 -
 24
24 -
 25
25 -
 26
26 -
 27
27 -
 28
28 -
 29
29 -
 30
30 -
 31
31 -
 32
32 -
 33
33 -
 34
34 -
 35
35 -
 36
36 -
 37
37 -
 38
38 -
 39
39 -
 40
40 -
 41
41 -
 42
42 -
 43
43 -
44
-
45
-
46
-
47
-
48
-
49
-
50
-
51
-
52
-
53
-
54
-
55
-
56
-
57
-
58
-
59
-
60
-
61
-
62
-
63
-
64
-
65
-
66
-
67
-
68
-
69
-
70
-
71
-
72
-
73
-
74
-
75
-
76
-
77
-
78
-
79
-
80
-
81
-
82
-
83
-
84
-
85
-
86
-
87
-
88
-
89
-
90
-
91
-
92
-
93
-
94
-
95
-
96
-
97
-
98
-
99
-
100
 |
 |

25
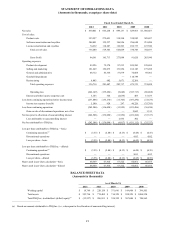
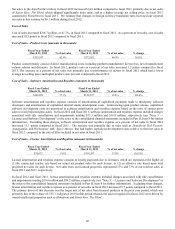
Changes in deferred net revenue reflect the deferral and subsequent recognition of net revenue related to undelivered elements
at the time of sale, such as online services that are offered in some of our games. The revenue deferrals are recognized as net
sales as the undelivered elements are delivered or, over the estimated online service period of generally six months, as
applicable. The changes in deferred net revenue are driven by the timing of the release of games that have undelivered
elements, and the subsequent timing of the delivery of those undelivered elements. Generally, as it relates to revenue deferrals
related to the online services, revenue deferred in the first half of our fiscal year would be recognized by the end of that fiscal
year, and revenue deferred in the second half of the fiscal year would be partially recognized in that fiscal year with the
remaining amounts of deferred revenue recognized in the following fiscal year.
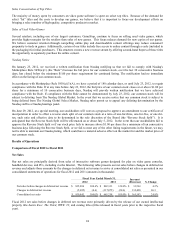
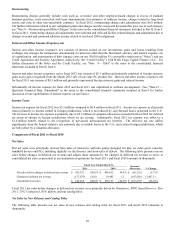
Net Sales by New Releases and Catalog Titles
The following table presents our net sales of new releases (titles initially released in the respective fiscal year) and catalog titles
for fiscal 2012 and 2011 (amounts in thousands):
Fiscal Year Ended March 31, Increase/ %
2012 2011
(
Decrease
)
Chan
g
e
New releases $ 644,258 77.1% $ 604,618 75.4 % $ 39,640 6.6%
Catalo
g
191,638 22.9 197,715 24.6
(
6,077
)
(
3.1
)
Net sales before chan
g
es in deferred net revenue 835,896 100.0% 802,333 100.0 % 33,563 4.2
Chan
g
es in deferred net revenue
(
5,055
)
(
137,075
)
132,020 96.3
Consolidated net sales $ 830,841 $ 665,258 $ 165,583 24.9%
Net sales of our new releases increased $39.6 million in fiscal 2012 compared to fiscal 2011 primarily due to the release of
Saints Row: The Third which shipped significantly more units in fiscal 2012 than Homefront did in fiscal 2011. This increase
was partially offset by performance of uDraw which sold fewer units and at lower average net selling prices in fiscal 2012
compared to fiscal 2011.
Net sales of our catalog titles decreased $6.1 million in fiscal 2012 compared to fiscal 2011 primarily due to a decrease in the
number of catalog units sold.
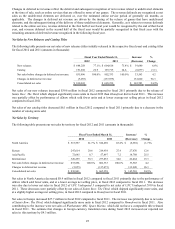
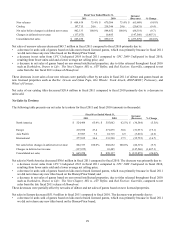
Net Sales by Territory
The following table presents our net sales by territory for fiscal 2012 and 2011 (amounts in thousands):
Fiscal Year Ended March 31, Increase/ %
2012 2011
(
Decrease
)
Chan
g
e
North America $ 515,597 61.7% $ 524,498 65.4 % $
(
8,901
)
(
1.7
)
%
Euro
p
e 247,614 29.6 219,938 27.4 27,676 12.6
Asia Pacific 72,685 8.7 57,897 7.2 14,788 25.5
International 320,299 38.3 277,835 34.6 42,464 15.3
Net sales before chan
g
es in deferred net revenue 835,896 100.0% 802,333 100.0% 33,563
4.2
Chan
g
es in deferred net revenue
(
5,055
)
(
137,075
)
132,020
96.3
Consolidated net sales $ 830,841 $ 665,258 $ 165,583 24.9%
Net sales in North America decreased $8.9 million in fiscal 2012 compared to fiscal 2011 primarily due to the performance of
uDraw which sold fewer units, and at a lower average net selling price, in fiscal 2012 compared to fiscal 2011. The decrease
was also due to lower net sales in fiscal 2012 of UFC Undisputed 3 compared to net sales of UFC Undisputed 2010 in fiscal
2011. These decreases were partially offset by net sales of Saints Row: The Third, which shipped significantly more units, and
at a slightly higher average net selling price, in fiscal 2012 compared to Homefront in fiscal 2011.
Net sales in Europe increased $27.7 million in fiscal 2012 compared to fiscal 2011. The increase was primarily due to net sales
of Saints Row: The Third, which shipped significantly more units in fiscal 2012 compared to Homefront in fiscal 2011. Also
contributing to the increase were net sales of Warhammer 40K: Space Marine, which did not have a comparable title released
in fiscal 2011. We estimate that changes in foreign currency translation rates during fiscal 2012 increased our reported net
sales in this territory by $4.3 million.