THQ 2012 Annual Report Download - page 54
Download and view the complete annual report
Please find page 54 of the 2012 THQ annual report below. You can navigate through the pages in the report by either clicking on the pages listed below, or by using the keyword search tool below to find specific information within the annual report.-
 1
1 -
2
-
3
-
4
-
5
-
6
-
7
-
8
-
9
-
10
-
11
-
12
-
13
-
14
-
15
-
16
-
17
-
18
-
19
-
20
-
21
-
22
-
23
-
24
-
25
-
26
-
27
-
28
-
29
-
30
-
31
-
32
-
33
-
34
-
35
-
36
-
37
-
38
-
39
-
40
-
41
-
42
-
43
-
 44
44 -
 45
45 -
 46
46 -
 47
47 -
 48
48 -
 49
49 -
 50
50 -
 51
51 -
 52
52 -
 53
53 -
 54
54 -
 55
55 -
 56
56 -
 57
57 -
 58
58 -
 59
59 -
 60
60 -
 61
61 -
 62
62 -
 63
63 -
 64
64 -
65
-
66
-
67
-
68
-
69
-
70
-
71
-
72
-
73
-
74
-
75
-
76
-
77
-
78
-
79
-
80
-
81
-
82
-
83
-
84
-
85
-
86
-
87
-
88
-
89
-
90
-
91
-
92
-
93
-
94
-
95
-
96
-
97
-
98
-
99
-
100
 |
 |

46
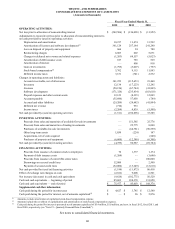
THQ INC. AND SUBSIDIARIES
CONSOLIDATED STATEMENTS OF CASH FLOWS
(Amounts in thousands)
Fiscal Year Ended March 31,
2012 2011 2010
OPERATING ACTIVITIES:
Net loss
p
rior to allocation of noncontrollin
g
interest $
(
242,506
)
$
(
136,098
)
$
(
11,952
)
Adjustments to reconcile net loss prior to allocation of noncontrolling interest to
net cash
p
rovided b
y
(
used in
)
o
p
eratin
g
activities:
De
p
reciation and amortization 10,217 11,474
13,592
Amortization of licenses and software develo
p
ment(1) 361,124 257,184
241,240
Loss on dis
p
osal of
p
ro
p
ert
y
and e
q
ui
p
ment 666 24
780
Restructurin
g
char
g
es 6,803 602
5,671
Chan
g
es in deferred net revenue and related ex
p
enses
(
1,263
)
68,557
(
5,023
)
Amortization of debt issuance costs 187 785
529
Amortization of interest
—
808
818
Gain on investments
(
1,795
)
(
3,007
)
(
797
)
Stoc
k
-
b
ased com
p
ensation(2) 5,762 9,115
11,883
Deferred income taxes 3,151
(
741
)
2,532
Chan
g
es in o
p
eratin
g
assets and liabilities:
Accounts receivable, net of allowances 141,253
(
115,653
)
23,460
Inventor
y
12,134
(
17,223
)
12,245
Licenses
(
50,156
)
(
67,744
)
(
41,809
)
Software develo
p
ment
(
171,326
)
(
235,434
)
(
183,610
)
Pre
p
aid ex
p
enses and other current assets 12,123
(
8,335
)
12,009
Accounts
p
a
y
able
(
55,696
)
57,658
(
789
)
Accrued and other liabilities
(
29,209
)
(
24,642
)
(
41,894
)
Deferred net revenue
(
716
)
933
—
Income taxes
(
2,264
)
4,839
(
5,500
)
Net cash
p
rovided b
y
(
used in
)
o
p
eratin
g
activities
(
1,511
)
(
196,898
)
33,385
INVESTING ACTIVITIES:
Proceeds from sales and maturities of available-fo
r
-sale investments
—
151,565
25,776
Proceeds from sales and maturities of tradin
g
investments
—
22,775
8,000
Purchases of available-fo
r
-sale investments
—
(
64,781
)
(
96,559
)
Other lon
g
-term assets 1,850
(
224
)
147
Ac
q
uisitions, net of cash ac
q
uire
d
—
—
(
840
)
Purchases of
p
ro
p
ert
y
and e
q
ui
p
ment
(
6,609
)
(
12,348
)
(
6,308
)
Net cash
p
rovided b
y
(
used in
)
investin
g
activities
(
4,759
)
96,987
(
69,784
)
FINANCING ACTIVITIES:
Proceeds from issuance of common stock to em
p
lo
y
ees 70 1,377
1,174
Pa
y
ment of debt issuance costs
(
1,264
)
—
(
3,646
)
Proceeds from issuance of convertible senior notes
—
—
100,000
Borrowin
g
s on secured credit lines 52,000
—
2,500
Pa
y
ment of secured credit lines
(
52,000
)
(
13,249
)
(
13,610
)
Net cash
p
rovided b
y
(
used in
)
financin
g
activities
(
1,194
)
(
11,872
)
86,418
Effect of exchan
g
e rate chan
g
es on cash
(
2,162
)
9,008
6,501
Net increase
(
decrease
)
in cash and cash e
q
uivalents
(
9,626
)
(
102,775
)
56,520
Cash and cash e
q
uivalents
—
b
e
g
innin
g
of
p
erio
d
85,603 188,378
131,858
Cash and cash e
q
uivalents
—
end of
p
erio
d
$ 75,977 $ 85,603
$ 188,378
Su
pp
lemental cash flow information:
Cash
p
aid durin
g
the
p
eriod for income taxes $ 4,627 $ 3,745
$ 12,580
Cash
p
aid durin
g
the
p
eriod for interest, net of amounts ca
p
italize
d
(3) $
—
$ 26
$ 2,876
________________________________
(1) Amounts exclude amortization of capitalized stock-based compensation expense.
(2) Amounts include the net effects of capitalization and amortization of stock-based compensation expense.
(3) Cash paid during the period for interest is presented net of amounts capitalized of $5.4 million, $5.0 million, and zero, in fiscal 2012, fiscal 2011, and
fiscal 2010, respectively (see "Note 21 - Quarterly Financial Data (Unaudited)").
See notes to consolidated financial statements.