THQ 2012 Annual Report Download - page 63
Download and view the complete annual report
Please find page 63 of the 2012 THQ annual report below. You can navigate through the pages in the report by either clicking on the pages listed below, or by using the keyword search tool below to find specific information within the annual report.-
 1
1 -
2
-
3
-
4
-
5
-
6
-
7
-
8
-
9
-
10
-
11
-
12
-
13
-
14
-
15
-
16
-
17
-
18
-
19
-
20
-
21
-
22
-
23
-
24
-
25
-
26
-
27
-
28
-
29
-
30
-
31
-
32
-
33
-
34
-
35
-
36
-
37
-
38
-
39
-
40
-
41
-
42
-
43
-
44
-
45
-
46
-
47
-
48
-
49
-
50
-
51
-
52
-
 53
53 -
 54
54 -
 55
55 -
 56
56 -
 57
57 -
 58
58 -
 59
59 -
 60
60 -
 61
61 -
 62
62 -
 63
63 -
 64
64 -
 65
65 -
 66
66 -
 67
67 -
 68
68 -
 69
69 -
 70
70 -
 71
71 -
 72
72 -
 73
73 -
74
-
75
-
76
-
77
-
78
-
79
-
80
-
81
-
82
-
83
-
84
-
85
-
86
-
87
-
88
-
89
-
90
-
91
-
92
-
93
-
94
-
95
-
96
-
97
-
98
-
99
-
100
 |
 |

55
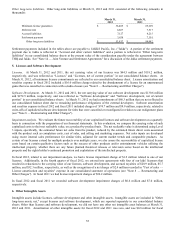
Other long-term liabilities. Other long-term liabilities at March 31, 2012 and 2011 consisted of the following (amounts in
thousands):
March 31,
2012
March 31,
2011
Minimum license
g
uarantees $ 36,405 $ 69,209
Deferred rent 6,667 7,517
Accrued liabilities 7,127 4,215
Settlement
p
a
y
ment 3,638 7,101
Other lon
g
-term liabilities $53,837 $ 88,042
Settlement payments included in the tables above are payable to JAKKS Pacific, Inc. ("Jakks"). A portion of the settlement
payment due to Jakks is reflected in "Accrued and other current liabilities" and a portion is reflected in "Other long-term
liabilities" in our consolidated balance sheets at the present value of the consideration payable under the agreement between
THQ and Jakks. See "Note 14 — Joint Venture and Settlement Agreements" for a discussion of the Jakks settlement payments.
5. Licenses and Software Development
Licenses. At March 31, 2012 and 2011, the net carrying value of our licenses was $64.5 million and $118.2 million,
respectively, and was reflected as “Licenses” and “Licenses, net of current portion” in our consolidated balance sheets. At
March 31, 2012, all minimum license commitments are reflected in our consolidated balance sheet. License amortization and
royalties expense in fiscal 2012 included a $16.0 million charge related to the abandonment of a license for an unannounced
game that was cancelled in connection with a studio closure (see "Note 8 — Restructuring and Other Charges").
Software Development. At March 31, 2012 and 2011, the net carrying value of our software development was $130.6 million
and $272.5 million, respectively, and was reflected as “Software development” and “Software development, net of current
portion” in our consolidated balance sheets. At March 31, 2012 we had commitments of $68.3 million that are not reflected in
our consolidated balance sheet due to remaining performance obligations of the external developers. Software amortization
and royalties expense in fiscal 2012 and fiscal 2011 included charges of $74.7 million and $9.9 million, respectively, related to
write-offs of capitalized software development for titles that were cancelled or reconfigured in relation to our realignment plans
(see "Note 8 — Restructuring and Other Charges").
Impairment analysis. We evaluate the future recoverability of our capitalized licenses and software development on a quarterly
basis in connection with the preparation of our financial statements. In this evaluation, we compare the carrying value of such
capitalized costs to their net realizable value, on a product-by-product basis. The net realizable value is determined using Level
3 inputs, specifically, the estimated future net sales from the product, reduced by the estimated future direct costs associated
with the product such as completion costs, cost of sales, and selling and marketing expenses. Net sales inputs are developed
using recent internal sales performance for similar titles, adjusted for current market trends and comparable products. As
certain of our licenses extend for multiple products over multiple years, we also assess the recoverability of capitalized license
costs based on certain qualitative factors such as the success of other products and/or entertainment vehicles utilizing the
intellectual property, whether there are any future planned theatrical releases or television series based on the intellectual
property and the rights holder's continued promotion and exploitation of the intellectual property.
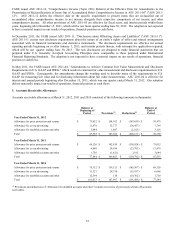
In fiscal 2012, related to our impairment analysis, we had a license impairment charge of $1.2 million related to one of our
licenses. Additionally, in the fourth quarter of fiscal 2012, we entered into agreements with four of our kids' licensors that
resulted in reductions to the carrying value of our licenses, software development, and accrued royalties of $28.9 million, $5.7
million, and $32.3 million, respectively, as well as the recognition of a net charge of $2.4 million recorded in "Cost of sales —
License amortization and royalties" expense in our consolidated statement of operations (see "Note 8 — Restructuring and
Other Charges"). In fiscal 2011 we had license impairment charges of $36.2 million.
In fiscal 2012 and fiscal 2011 we recorded software development impairment charges of $0.6 million and $7.0 million,
respectively.
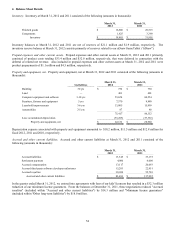
6. Other Intangible Assets
Intangible assets include licenses, software development and other intangible assets. Intangible assets are included in "Other
long-term assets, net," except licenses and software development, which are reported separately in our consolidated balance
sheets. Other than licenses and software development, we did not have any other net intangible asset balances at March 31,
2012 and 2011. Amortization of other intangible assets for fiscal 2012 and 2011 was zero, and was $0.8 million for fiscal