THQ 2012 Annual Report Download - page 82
Download and view the complete annual report
Please find page 82 of the 2012 THQ annual report below. You can navigate through the pages in the report by either clicking on the pages listed below, or by using the keyword search tool below to find specific information within the annual report.-
 1
1 -
2
-
3
-
4
-
5
-
6
-
7
-
8
-
9
-
10
-
11
-
12
-
13
-
14
-
15
-
16
-
17
-
18
-
19
-
20
-
21
-
22
-
23
-
24
-
25
-
26
-
27
-
28
-
29
-
30
-
31
-
32
-
33
-
34
-
35
-
36
-
37
-
38
-
39
-
40
-
41
-
42
-
43
-
44
-
45
-
46
-
47
-
48
-
49
-
50
-
51
-
52
-
53
-
54
-
55
-
56
-
57
-
58
-
59
-
60
-
61
-
62
-
63
-
64
-
65
-
66
-
67
-
68
-
69
-
70
-
71
-
 72
72 -
 73
73 -
 74
74 -
 75
75 -
 76
76 -
 77
77 -
 78
78 -
 79
79 -
 80
80 -
 81
81 -
 82
82 -
 83
83 -
 84
84 -
 85
85 -
 86
86 -
 87
87 -
 88
88 -
 89
89 -
 90
90 -
 91
91 -
 92
92 -
93
-
94
-
95
-
96
-
97
-
98
-
99
-
100
 |
 |

74
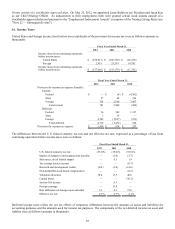
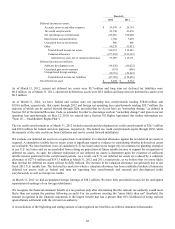
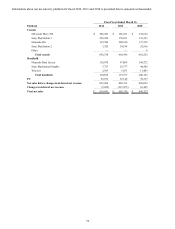
Information about our net sales by platform for fiscal 2012, 2011 and 2010 is presented below (amounts in thousands):
Fiscal Year Ended March 31,
Platform 2012 2011 2010
Console
Microsoft Xbox 360 $ 306,423 $ 201,851 $ 236,816
Son
y
Pla
y
Station 3 229,220 170,811 191,393
Nintendo Wii 119,546 220,140 137,219
Son
y
Pla
y
Station 2 3,329 24,194 52,816
Othe
r
—
—
8
Total console 658,518 616,996 618,252
Handheld
Nintendo Dual Screen 110,070 97,869 144,272
Son
y
Pla
y
Station Portable 7,727 29,777 44,508
Wireless 2,709 5,551 11,403
Total handheld 120,506 133,197 200,183
PC 56,872 52,140 70,217
Net sales before chan
g
es in deferred net revenue 835,896 802,333 888,652
Chan
g
es in deferred net revenue
(
5,055
)
(
137,075
)
10,485
Total net sales $ 830,841 $ 665,258
$ 899,137