THQ 2012 Annual Report Download - page 29
Download and view the complete annual report
Please find page 29 of the 2012 THQ annual report below. You can navigate through the pages in the report by either clicking on the pages listed below, or by using the keyword search tool below to find specific information within the annual report.-
 1
1 -
2
-
3
-
4
-
5
-
6
-
7
-
8
-
9
-
10
-
11
-
12
-
13
-
14
-
15
-
16
-
17
-
18
-
 19
19 -
 20
20 -
 21
21 -
 22
22 -
 23
23 -
 24
24 -
 25
25 -
 26
26 -
 27
27 -
 28
28 -
 29
29 -
 30
30 -
 31
31 -
 32
32 -
 33
33 -
 34
34 -
 35
35 -
 36
36 -
 37
37 -
 38
38 -
 39
39 -
40
-
41
-
42
-
43
-
44
-
45
-
46
-
47
-
48
-
49
-
50
-
51
-
52
-
53
-
54
-
55
-
56
-
57
-
58
-
59
-
60
-
61
-
62
-
63
-
64
-
65
-
66
-
67
-
68
-
69
-
70
-
71
-
72
-
73
-
74
-
75
-
76
-
77
-
78
-
79
-
80
-
81
-
82
-
83
-
84
-
85
-
86
-
87
-
88
-
89
-
90
-
91
-
92
-
93
-
94
-
95
-
96
-
97
-
98
-
99
-
100
 |
 |

21
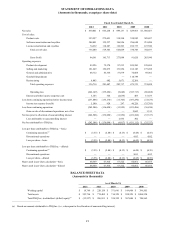
STATEMENT OF OPERATIONS DATA
(Amounts in thousands, except per share data)
Fiscal Year Ended March 31,
2012 2011 2010 2009 2008
Net sales $ 830,841 $ 665,258 $ 899,137 $ 829,963 $ 1,030,467
Cost of sales:
Product costs 353,597 272,021 318,590 338,882 389,097
Software amortization and ro
y
alties 308,051 129,237 196,956 296,688
231,800
License amortization and ro
y
alties 74,632 118,287 110,503 102,773
123,580
Total cost of sales 736,280 519,545 626,049 738,343 744,477
Gross Profi
t
94,561 145,713 273,088 91,620
285,990
O
p
eratin
g
ex
p
enses:
Product develo
p
men
t
89,526 79,374 87,233 109,201
128,869
Sellin
g
and marketin
g
191,669 156,075 131,954 162,183
175,288
General and administrative 48,712 45,356 57,879 76,884 69,901
Goodwill im
p
airmen
t
—
—
118,799
—
Restructurin
g
6,803 602 5,671 12,266
—
Total o
p
eratin
g
ex
p
enses 336,710 281,407 282,737 479,333 374,058
O
p
eratin
g
loss
(
242,149
)
(
135,694
)
(
9,649
)
(
387,713
)
(
88,068
)
Interest and other income
(
ex
p
ense
)
, ne
t
5,143 524
(
2,056
)
483 15,433
Loss from continuin
g
o
p
erations before income taxes
(
237,006
)
(
135,170
)
(
11,705
)
(
387,230
)
(
72,635
)
Income tax ex
p
ense
(
benefit
)
5,500 928 247 46,226
(
35,785
)
Loss from continuin
g
o
p
erations
(
242,506
)
(
136,098
)
(
11,952
)
(
433,456
)
(
36,850
)
Gain on sale of discontinued o
p
erations, net of tax
—
—
—
2,042
1,513
Net loss
p
rior to allocation of noncont
r
ollin
g
interes
t
(
242,506
)
(
136,098
)
(
11,952
)
(
431,414
)
(
35,337
)
Loss attributable to noncontrollin
g
interest
—
—
2,935 302
—
Net loss attributable to THQ Inc $
(
242,506
)
$
(
136,098
)
$
(
9,017
)
$
(
431,112
)
$
(
35,337
)
Loss
p
er share attributable to THQ Inc.
—
b
asic:
Continuin
g
o
p
erations(a) $
(
3.55
)
$
(
2.00
)
$
(
0.13
)
$
(
6.48
)
$
(
0.55
)
Discontinued o
p
erations
—
—
—
0.03 0.02
Loss
p
er share
—
b
asic $
(
3.55
)
$
(
2.00
)
$
(
0.13
)
$
(
6.45
)
$
(
0.53
)
Loss
p
er share attributable to THQ Inc.
—
diluted:
Continuin
g
o
p
erations(a) $
(
3.55
)
$
(
2.00
)
$
(
0.13
)
$
(
6.48
)
$
(
0.55
)
Discontinued o
p
erations
—
—
—
0.03 0.02
Loss
p
er share
—
diluted $
(
3.55
)
$
(
2.00
)
$
(
0.13
)
$
(
6.45
)
$
(
0.53
)
Shares used in
p
er share calculation
—
b
asic 68,369 67,910 67,522 66,861
66,475
Shares used in
p
er share calculation
—
diluted 68,369 67,910 67,522 66,861
66,475
BALANCE SHEET DATA
(Amounts in thousands)
As of March 31,
2012 2011 2010 2009 2008
Workin
g
ca
p
ital $ 18,749 $ 220,158 $ 371,641 $ 189,604 $ 396,505
Total assets $ 392,794 $ 774,405 $ 714,329 $ 598,329 $ 1,084,320
Total THQ Inc. stockholders'
(
deficit
)
e
q
uit
y
(a) $
(
32,327
)
$ 206,831 $ 324,355 $ 307,040 $ 740,569
________________________
(a) Based on amounts attributable to THQ Inc. (i.e., subsequent to the allocation of noncontrolling interest).