THQ 2012 Annual Report Download - page 39
Download and view the complete annual report
Please find page 39 of the 2012 THQ annual report below. You can navigate through the pages in the report by either clicking on the pages listed below, or by using the keyword search tool below to find specific information within the annual report.-
 1
1 -
2
-
3
-
4
-
5
-
6
-
7
-
8
-
9
-
10
-
11
-
12
-
13
-
14
-
15
-
16
-
17
-
18
-
19
-
20
-
21
-
22
-
23
-
24
-
25
-
26
-
27
-
28
-
 29
29 -
 30
30 -
 31
31 -
 32
32 -
 33
33 -
 34
34 -
 35
35 -
 36
36 -
 37
37 -
 38
38 -
 39
39 -
 40
40 -
 41
41 -
 42
42 -
 43
43 -
 44
44 -
 45
45 -
 46
46 -
 47
47 -
 48
48 -
 49
49 -
50
-
51
-
52
-
53
-
54
-
55
-
56
-
57
-
58
-
59
-
60
-
61
-
62
-
63
-
64
-
65
-
66
-
67
-
68
-
69
-
70
-
71
-
72
-
73
-
74
-
75
-
76
-
77
-
78
-
79
-
80
-
81
-
82
-
83
-
84
-
85
-
86
-
87
-
88
-
89
-
90
-
91
-
92
-
93
-
94
-
95
-
96
-
97
-
98
-
99
-
100
 |
 |

31
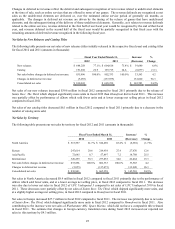
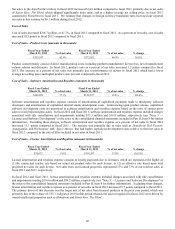
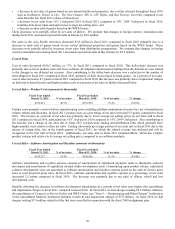
Cost of Sales—License Amortization and Royalties (amounts in thousands)
Fiscal Year Ended
March 31, 2011 % of net sales
Fiscal Year Ended
March 31, 2010 % of net sales % chan
g
e
$118,287 17.8% $110,503 12.3% 7.0%
License amortization and royalties expense consists of royalty payments due to licensors, which are expensed at the higher of
(1) the contractual royalty rate based on actual net product sales for such license, or (2) an effective rate based upon total
projected net sales for such license. Also included in license amortization and royalties expense in fiscal 2010 is venture
partner expense totaling $14.5 million (see "Note 2 — Summary of Significant Accounting Policies" in the notes to the
consolidated financial statements included in Item 8 of the fiscal 2011 10-K). Net sales from our licensed properties, excluding
the impact of changes in deferred net revenue, represented 65% and 70% of our total net sales in fiscal 2011 and fiscal 2010,
respectively.
Excluding one-time items recorded in fiscal 2010 that netted to a charge of $5.3 million in venture partner expense, and
excluding the impact of changes in deferred net revenue and related costs, license amortization and royalties expense would
have increased 3.5 points as a percent of net sales in fiscal 2011 compared to fiscal 2010. (See "Note 14 — Joint Venture and
Settlement Agreements" in the notes to the consolidated financial statements included in Item 8 of the fiscal 2011 10-K for
further discussion of the one-time items.) This increase was primarily due to impairment charges of $30.3 million recorded in
the three months ended December 31, 2010. These impairments resulted from our reevaluation of sales expectations on kids
movie-based licensed titles given the recent significant industry-wide slowdown in sales of console titles aimed at children,
particularly movie-based kids titles. Also contributing to the increase in license amortization and royalties expense as a percent
of net sales in fiscal 2011 compared to fiscal 2010 was a high effective license amortization rate on Megamind in fiscal 2011.
These increases were partially offset by a change in our sales mix towards more owned intellectual properties in fiscal 2011
compared to fiscal 2010.
Operating Expenses
Our operating expenses were $281.4 million in fiscal 2011 and $282.7 million in fiscal 2010. Fiscal 2011 operating expenses
included an 18.3% increase in selling and marketing expenses compared to fiscal 2010, primarily due to the launch of uDraw.
These higher selling and marketing expenses were offset by decreases in product development, general and administrative, and
restructuring expenses.
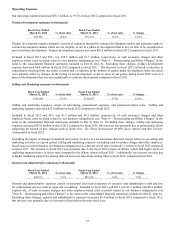
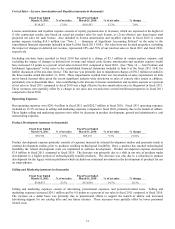
Product Development (amounts in thousands)
Fiscal Year Ended
March 31, 2011 % of net sales
Fiscal Year Ended
March 31, 2010 % of net sales % chan
g
e
$79,374 11.9% $87,233 9.7%
(
9.0
)
%
Product development expense primarily consists of expenses incurred by internal development studios and payments made to
external development studios prior to products reaching technological feasibility. Once a product has reached technological
feasibility the related development costs are capitalized to software development. Product development expense decreased
$7.9 million in fiscal 2011 compared to fiscal 2010. The decrease was primarily due to a shift in our mix of products under
development to a higher portion of technologically feasible products. The decrease was also due to a reduction in product
development for the legacy wireless platforms which excludes our continued investment in the development of products for use
on smart-phones.
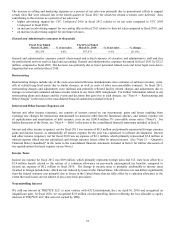
Selling and Marketing (amounts in thousands)
Fiscal Year Ended
March 31, 2011 % of net sales
Fiscal Year Ended
March 31, 2010 % of net sales % chan
g
e
$156,075 23.5% $131,954 14.7% 18.3%
Selling and marketing expenses consist of advertising, promotional expenses, and personnel-related costs. Selling and
marketing expenses increased $24.1 million and by 8.8 points as a percent of net sales in fiscal 2011 compared to fiscal 2010.
The increase on a dollar basis was primarily due to promotional efforts to support the launch of uDraw and increased
advertising support for our catalog titles and our future releases. These increases were partially offset by lower personnel
related costs.