THQ 2012 Annual Report Download - page 43
Download and view the complete annual report
Please find page 43 of the 2012 THQ annual report below. You can navigate through the pages in the report by either clicking on the pages listed below, or by using the keyword search tool below to find specific information within the annual report.-
 1
1 -
2
-
3
-
4
-
5
-
6
-
7
-
8
-
9
-
10
-
11
-
12
-
13
-
14
-
15
-
16
-
17
-
18
-
19
-
20
-
21
-
22
-
23
-
24
-
25
-
26
-
27
-
28
-
29
-
30
-
31
-
32
-
 33
33 -
 34
34 -
 35
35 -
 36
36 -
 37
37 -
 38
38 -
 39
39 -
 40
40 -
 41
41 -
 42
42 -
 43
43 -
 44
44 -
 45
45 -
 46
46 -
 47
47 -
 48
48 -
 49
49 -
 50
50 -
 51
51 -
 52
52 -
 53
53 -
54
-
55
-
56
-
57
-
58
-
59
-
60
-
61
-
62
-
63
-
64
-
65
-
66
-
67
-
68
-
69
-
70
-
71
-
72
-
73
-
74
-
75
-
76
-
77
-
78
-
79
-
80
-
81
-
82
-
83
-
84
-
85
-
86
-
87
-
88
-
89
-
90
-
91
-
92
-
93
-
94
-
95
-
96
-
97
-
98
-
99
-
100
 |
 |

35
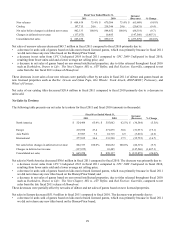
million; these amounts were capitalized as part of in-process software development costs. There were no outstanding
borrowings under the Credit Facility as of March 31, 2012.
As of March 31, 2012, we were in compliance with all applicable covenants and requirements in the Credit Facility.
At March 31, 2012, approximately 57% of our cash and cash equivalents were domiciled in foreign tax jurisdictions. We
expect to repatriate all or a portion of these funds to the United States, and we may be required to pay additional taxes (such as
foreign withholdings) in certain foreign jurisdictions, which we do not expect to be significant. We do not anticipate that such
repatriation, in the short-term, would result in actual cash payments in the United States, as the taxable event would likely be
offset by the utilization of our net operating losses and tax credits.
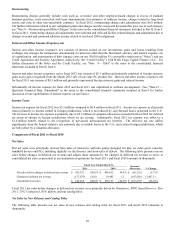
Cash Flow from Operating Activities. Cash used in operations was $1.5 million in fiscal 2012 compared to $196.9 million in
fiscal 2011. The change in cash flow from operations was primarily due to an increase in collections of receivables related to
the timing of releases in the fourth quarter of fiscal 2012 and fiscal 2011 and a decrease in investments in software development
and licenses. These changes were partially offset by an increase in cash used for payments of our obligations.
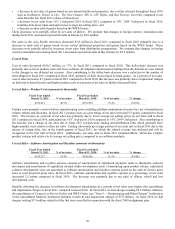
Cash Flow from Investing Activities. Cash used in investing activities was $4.8 million in fiscal 2012 compared to $97.0
million cash provided by investing activities in fiscal 2011. The change in cash flow from investing activities was primarily due
to proceeds from sales and maturities of short-term investments in fiscal 2011.
Cash Flow from Financing Activities. Cash used in financing activities was $1.2 million in fiscal 2012 compared to $11.9
million in fiscal 2011. The change in cash flow from financing activities was primarily due to the repayment of our secured
credit line in fiscal 2011.
Effect of exchange rate changes on cash. Changes in foreign currency translation rates decreased our reported cash balance
by $2.2 million.
Key Balance Sheet Accounts
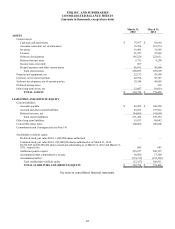
At March 31, 2012, our total current assets were $290.0 million, down from $599.7 million at March 31, 2011. In addition to
cash and cash equivalents, our current assets primarily consisted of:
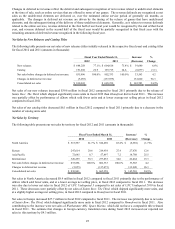
Accounts Receivable. Accounts receivable decreased $145.6 million, from $161.6 million at March 31, 2011 to $16.0 million
at March 31, 2012. The decrease was primarily due to lower sales volumes and timing of releases in the fourth quarter of fiscal
2012 and fiscal 2011, as well as expedited collections of receivables under the Purchase Agreement. Accounts receivable
allowances were $70.4 million at March 31, 2012, a $17.2 million decrease from $87.6 million at March 31, 2011. Allowances
for price protection and returns as a percentage of trailing nine-month net sales, excluding the impact of changes in deferred net
revenue, were 8% and 11% at March 31, 2012 and 2011, respectively. The decrease was primarily due to improved sell-
through of certain of our recent releases. We believe our current allowances are adequate based on historical experience,
inventory remaining in the retail channel, and the rate of inventory sell-through in the retail channel.
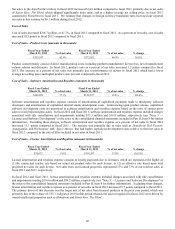
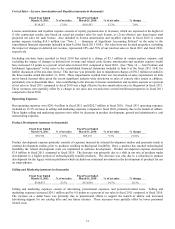
Inventory. Inventory decreased $13.4 million, from $31.9 million at March 31, 2011 to $18.5 million at March 31, 2012. The
decrease in inventory was primarily due to the timing of releases. Inventory turns, excluding the impact of changes in deferred
costs, on a rolling twelve-month basis were 14 at March 31, 2012 and 2011, respectively.
Licenses. Our investment in licenses, including the long-term portion, decreased $53.7 million, from $118.2 million at
March 31, 2011 to $64.5 million at March 31, 2012. The decrease is due to continued amortization related to sales of licensed
products, as well as reductions related to negotiations with four of our kids' licensors which reduced our minimum license
guarantees.
Software Development. Capitalized software development, including the long-term portion, decreased $141.9 million, from
$272.5 million at March 31, 2011 to $130.6 million at March 31, 2012. The decrease in software development is primarily the
result of amortization of released titles, a decrease in spend on software development, and the expensing of previously
capitalized costs related to cancelled titles.
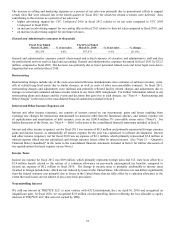
Total current liabilities at March 31, 2012, were $271.3 million, down from $379.5 million at March 31, 2011. Current
liabilities primarily consisted of:
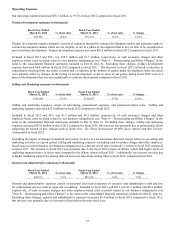
Accounts Payable. Accounts payable decreased $57.7 million, from $100.6 million at March 31, 2011 to $42.9 million at
March 31, 2012. The decrease was primarily due to a decrease in product-related and advertising payables resulting from a
lighter release schedule.