THQ 2012 Annual Report Download - page 53
Download and view the complete annual report
Please find page 53 of the 2012 THQ annual report below. You can navigate through the pages in the report by either clicking on the pages listed below, or by using the keyword search tool below to find specific information within the annual report.-
 1
1 -
2
-
3
-
4
-
5
-
6
-
7
-
8
-
9
-
10
-
11
-
12
-
13
-
14
-
15
-
16
-
17
-
18
-
19
-
20
-
21
-
22
-
23
-
24
-
25
-
26
-
27
-
28
-
29
-
30
-
31
-
32
-
33
-
34
-
35
-
36
-
37
-
38
-
39
-
40
-
41
-
42
-
 43
43 -
 44
44 -
 45
45 -
 46
46 -
 47
47 -
 48
48 -
 49
49 -
 50
50 -
 51
51 -
 52
52 -
 53
53 -
 54
54 -
 55
55 -
 56
56 -
 57
57 -
 58
58 -
 59
59 -
 60
60 -
 61
61 -
 62
62 -
 63
63 -
64
-
65
-
66
-
67
-
68
-
69
-
70
-
71
-
72
-
73
-
74
-
75
-
76
-
77
-
78
-
79
-
80
-
81
-
82
-
83
-
84
-
85
-
86
-
87
-
88
-
89
-
90
-
91
-
92
-
93
-
94
-
95
-
96
-
97
-
98
-
99
-
100
 |
 |

45
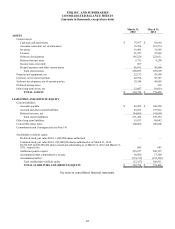
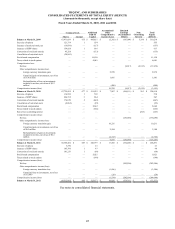
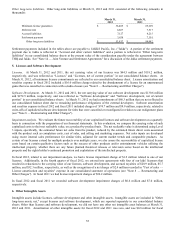
THQ INC. AND SUBSIDIARIES
CONSOLIDATED STATEMENTS OF TOTAL EQUITY (DEFICIT)
(Amounts in thousands, except share data)
Fiscal Years Ended March 31, 2010, 2011 and 2012
Common Stoc
k
Additional
Paid-In
Ca
p
ital
Accumulated
Other
Comprehensive
Income (Loss)
Retained
Earnings
(Accumulated
Deficit)
Non-
Controlling
Interest
Total
Equity
(Deficit) Shares Amount
Balance at March 31, 2009 67,471,659 $ 675 $ 495,851 $
(
2,392
)
$
(
187,094
)
$ 3,198 $ 310,238
Exercise of o
p
tions 121,714 1554
—
—
—
555
Issuance of restricted stock, net
(
16,836
)
—
(
157
)
—
—
—
(
157
)
Issuance of ESPP shares 134,928 1 616
—
—
—
617
Conversion of stock unit awards 43,328
—
(
133
)
—
—
—
(
133
)
Cancellation of restricted stoc
k
(
24,841
)
—
—
—
—
—
—
Stoc
k
-
b
ased com
p
ensation
—
—
11,150
—
—
—
11,150
Taxes related to stock o
p
tions
—
—
4,041
—
—
—
4,041
Com
p
rehensive loss:
Net loss
—
—
—
(
9,017
)
(
2,935
)
(
11,952
)
Other com
p
rehensive income
(
loss
)
Forei
g
n currenc
y
translation
g
ain
—
—
—
8,978
—
—
8,978
Unrealized gain on investments, net of tax
of $1.0 million
—
—
—
1,681
—
—
1,681
Reclassification of loss on investments
included in net loss, net of tax of $0.2
million
—
—
—
(
400
)
—
—
(
400
)
Com
p
rehensive income
(
loss
)
—
—
—
10,259
(
9,017
)
(
2,935
)
(
1,693
)
Balance at March 31, 2010 67,729,952 $ 677 $ 511,922 $ 7,867 $
(
196,111
)
$ 263 $ 324,618
Exercise of o
p
tions 114,990 1509
—
—
—
510
Issuance of ESPP shares 286,732 3 864
—
—
—
867
Conversion of stock unit awards 176,870 2
(
449
)
—
—
—
(
447
)
Cancellation of restricted stoc
k
(
8,062
)
—
(
25
)
—
—
—
(
25
)
Stoc
k
-
b
ased com
p
ensation
—
—
8,642
—
—
—
8,642
Taxes related to stock o
p
tions
—
—
(
666
)
—
—
—
(
666
)
Sale of non controllin
g
interest
—
—
—
—
—
(
263
)
(
263
)
Com
p
rehensive income
(
loss
)
:
Net loss
—
—
—
—
(
136,098
)
—
(
136,098
)
Other com
p
rehensive income
(
loss
)
Forei
g
n currenc
y
translation
g
ain
—
—
—
10,231
—
—
10,231
Unrealized gain on investments, net of tax
of $0.3 million
—
—
—
2,184
—
—
2,184
Reclassification of gain on investments
included in net loss, net of tax of $0.1
million
—
—
—
(
2,722
)
—
—
(
2,722
)
Com
p
rehensive income
(
loss
)
—
—
—
9,693
(
136,098
)
—
(
126,405
)
Balance at March 31, 2011 68,300,482 $ 683 $ 520,797 $ 17,560 $
(
332,209
)
$
—
$ 206,831
Exercise of o
p
tions 5,390
—
21
—
—
—
21
Issuance of ESPP shares 105,760 1 47
—
—
—
48
Conversion of stock unit awards 101,253 1
(
69
)
—
—
—
(
68
)
Stoc
k
-
b
ased com
p
ensation
—
—
5,021
—
—
—
5,021
Taxes related to stock o
p
tions
—
—
(
140
)
—
—
—
(
140
)
Com
p
rehensive income
(
loss
)
:
Net loss
—
—
—
—
(
242,506
)
—
(
242,506
)
Other com
p
rehensive income
(
loss
)
:
Forei
g
n currenc
y
translation loss
—
—
—
(
1,506
)
—
—
(
1,506
)
Unrealized loss on investments, net of tax
of $17,000
—
—
—
(
28
)
—
—
(
28
)
Com
p
rehensive income
(
loss
)
—
—
—
(
1,534
)
(
242,506
)
—
(
244,040
)
Balance at March 31, 2012 68,512,885 $ 685 $ 525,677 $ 16,026 $
(
574,715
)
$
—
$
(
32,327
)
See notes to consolidated financial statements.