THQ 2012 Annual Report Download - page 34
Download and view the complete annual report
Please find page 34 of the 2012 THQ annual report below. You can navigate through the pages in the report by either clicking on the pages listed below, or by using the keyword search tool below to find specific information within the annual report.-
 1
1 -
2
-
3
-
4
-
5
-
6
-
7
-
8
-
9
-
10
-
11
-
12
-
13
-
14
-
15
-
16
-
17
-
18
-
19
-
20
-
21
-
22
-
23
-
 24
24 -
 25
25 -
 26
26 -
 27
27 -
 28
28 -
 29
29 -
 30
30 -
 31
31 -
 32
32 -
 33
33 -
 34
34 -
 35
35 -
 36
36 -
 37
37 -
 38
38 -
 39
39 -
 40
40 -
 41
41 -
 42
42 -
 43
43 -
 44
44 -
45
-
46
-
47
-
48
-
49
-
50
-
51
-
52
-
53
-
54
-
55
-
56
-
57
-
58
-
59
-
60
-
61
-
62
-
63
-
64
-
65
-
66
-
67
-
68
-
69
-
70
-
71
-
72
-
73
-
74
-
75
-
76
-
77
-
78
-
79
-
80
-
81
-
82
-
83
-
84
-
85
-
86
-
87
-
88
-
89
-
90
-
91
-
92
-
93
-
94
-
95
-
96
-
97
-
98
-
99
-
100
 |
 |

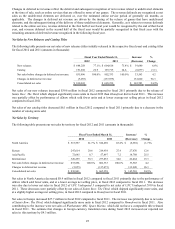
26
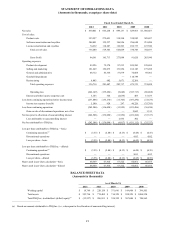
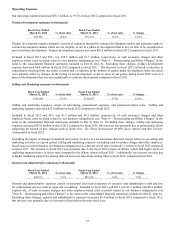
Net sales in the Asia Pacific territory in fiscal 2012 increased $14.8 million compared to fiscal 2011 primarily due to net sales
of Saints Row: The Third, which shipped significantly more units, and at a higher average net selling price, in fiscal 2012
compared to Homefront in fiscal 2011. We estimate that changes in foreign currency translation rates increased our reported
net sales in this territory by $6.1 million during fiscal 2012.
Cost of Sales
Cost of sales increased $216.7 million, or 41.7%, in fiscal 2012 compared to fiscal 2011. As a percent of net sales, cost of sales
increased 10.5 points in fiscal 2012 compared to fiscal 2011.
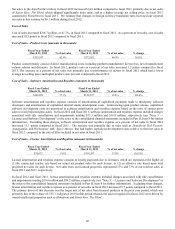
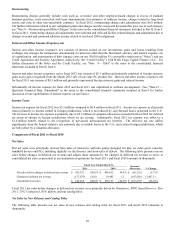
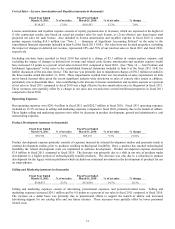
Cost of Sales - Product Costs (amounts in thousands)
Fiscal Year Ended
March 31, 2012 % of net sales
Fiscal Year Ended
March 31, 2011 % of net sales % chan
g
e
$353,597 42.6% $272,021 40.9% 30.0%
Product costs primarily consist of direct manufacturing costs, including platform manufacturer license fees, net of manufacturer
volume rebates and discounts. In fiscal 2012, product costs as a percent of net sales increased 1.7 points compared to fiscal
2011. The increase as a percent of net sales was primarily due to performance of uDraw in fiscal 2012 which had a lower
average net selling price and higher product costs per unit compared to fiscal 2011.
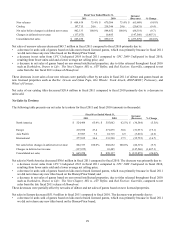
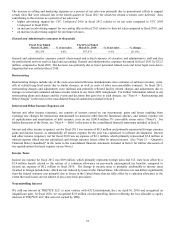
Cost of Sales - Software Amortization and Royalties (amounts in thousands)
Fiscal Year Ended
March 31, 2012 % of net sales
Fiscal Year Ended
March 31, 2011 % of net sales % chan
g
e
$308,051 37.1% $129,237 19.4% 138.4%
Software amortization and royalties expense consists of amortization of capitalized payments made to third-party software
developers and amortization of capitalized internal studio development costs. Commencing upon product release, capitalized
software development costs are amortized to software amortization and royalties expense based on the ratio of current gross
sales to total projected gross sales. In fiscal 2012 and fiscal 2011, software amortization and royalties expense included charges
associated with title cancellations and impairments totaling $75.3 million and $16.9 million, respectively (see "Note 5 —
Licenses and Software Development" in the notes to the consolidated financial statements included in Part II, Item 8 for further
information). Excluding these charges, software amortization and royalties expense as a percent of net sales in fiscal 2012
increased 11.1 points compared to fiscal 2011. The increase was primarily due to titles such as Homefront, Red Faction:
Armageddon, and Warhammer 40K: Space Marine, that had higher capitalized development costs relative to their net sales in
fiscal 2012, compared to the mix of titles included in net sales in fiscal 2011.
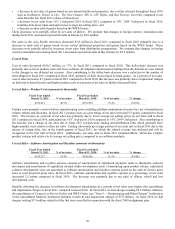
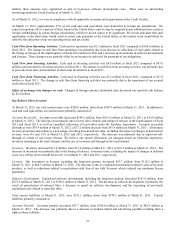
Cost of Sales - License Amortization and Royalties (amounts in thousands)
Fiscal Year Ended
March 31, 2012 % of net sales
Fiscal Year Ended
March 31, 2011 % of net sales % chan
g
e
$74,632 9.0% $118,287 17.8%
(
36.9
)
%
License amortization and royalties expense consists of royalty payments due to licensors, which are expensed at the higher of
(1) the contractual royalty rate based on actual net product sales for such license, or (2) an effective rate based upon total
projected net sales for such license. Net sales from our licensed properties represented 57% and 73% of our total net sales in
fiscal 2012 and 2011, respectively.
In fiscal 2012 and fiscal 2011, license amortization and royalties expense included charges associated with title cancellations
and impairments totaling $19.6 million and $36.2 million, respectively (see "Note 5 — Licenses and Software Development" in
the notes to the consolidated financial statements included in Part II, Item 8 for further information). Excluding these charges,
license amortization and royalties expense as a percent of net sales in fiscal 2012 decreased 5.7 points compared to fiscal 2011.
The primary driver of this decrease was the larger mix of net sales from licensed products in the prior year period, which was
primarily due to the release of UFC Undisputed 2010 in that period whereas net sales recognized in fiscal 2012 were driven by
owned intellectual properties such as Homefront and Saints Row: The Third.