THQ 2012 Annual Report Download - page 37
Download and view the complete annual report
Please find page 37 of the 2012 THQ annual report below. You can navigate through the pages in the report by either clicking on the pages listed below, or by using the keyword search tool below to find specific information within the annual report.-
 1
1 -
2
-
3
-
4
-
5
-
6
-
7
-
8
-
9
-
10
-
11
-
12
-
13
-
14
-
15
-
16
-
17
-
18
-
19
-
20
-
21
-
22
-
23
-
24
-
25
-
26
-
 27
27 -
 28
28 -
 29
29 -
 30
30 -
 31
31 -
 32
32 -
 33
33 -
 34
34 -
 35
35 -
 36
36 -
 37
37 -
 38
38 -
 39
39 -
 40
40 -
 41
41 -
 42
42 -
 43
43 -
 44
44 -
 45
45 -
 46
46 -
 47
47 -
48
-
49
-
50
-
51
-
52
-
53
-
54
-
55
-
56
-
57
-
58
-
59
-
60
-
61
-
62
-
63
-
64
-
65
-
66
-
67
-
68
-
69
-
70
-
71
-
72
-
73
-
74
-
75
-
76
-
77
-
78
-
79
-
80
-
81
-
82
-
83
-
84
-
85
-
86
-
87
-
88
-
89
-
90
-
91
-
92
-
93
-
94
-
95
-
96
-
97
-
98
-
99
-
100
 |
 |

29
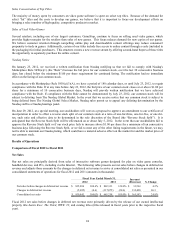
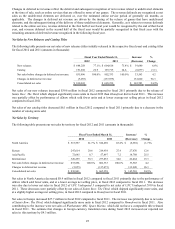
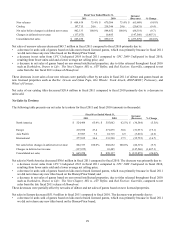
Fiscal Year Ended March 31, Increase/
(Decrease) % Chan
g
e 2011 2010
New releases $ 604,618 75.4% $ 670,306 75.4 % $
(
65,688
)
(
9.8
)
%
Catalo
g
197,715 24.6 218,346 24.6
(
20,631
)
(
9.4
)
Net sales before chan
g
es in deferred net revenue 802,333 100.0% 888,652 100.0 %
(
86,319
)
(
9.7
)
Chan
g
es in deferred net revenue
(
137,075
)
10,485
(
147,560
)
(
1,407.3
)
Consolidated net sales $ 665,258 $ 899,137 $
(
233,879
)
(
26.0
)
%
Net sales of our new releases decreased $65.7 million in fiscal 2011 compared to fiscal 2010 primarily due to:
• a decrease in units sold of games based on kids movie-based licensed games, which was primarily because in fiscal 2011
we did not release any new titles based on the Disney•Pixar brand;
• a decrease in net sales from UFC Undisputed 2010 in fiscal 2011 compared to UFC 2009 Undisputed in fiscal 2010,
resulting from fewer units sold and a lower average net selling price; and
• a decrease in net sales of games based on our owned intellectual properties, due to titles released throughout fiscal 2010
such as Darksiders, Drawn to Life: The Next Chapter, MX vs. ATV Reflex, and Red Faction: Guerrilla, compared to net
sales from the late fiscal 2011 release of Homefront.
These decreases in net sales of our new releases were partially offset by net sales in fiscal 2011 of uDraw and games based on
new licensed properties such as Barbie: Groom and Glam Pups, Hot Wheels: Track Attack, JEOPARDY!, Pictionary, and
Wheel of Fortune.
Net sales of our catalog titles decreased $20.6 million in fiscal 2011 compared to fiscal 2010 primarily due to a decrease in
units sold.
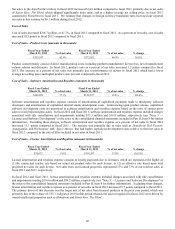
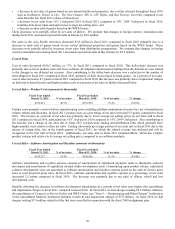
Net Sales by Territory
The following table presents our net sales by territory for fiscal 2011 and fiscal 2010 (amounts in thousands):
Fiscal Year Ended March 31, Increase/
(
Decrease
)
% Chan
g
e 2011 2010
North America $ 524,498 65.4% $ 555,062 62.5 % $
(
30,564
)
(
5.5
)
%
Euro
p
e 219,938 27.4 271,875 30.6
(
51,937
)
(
19.1
)
Asia Pacific 57,897 7.2 61,715 6.9
(
3,818
)
(
6.2
)
International 277,835 34.6 333,590 37.5
(
55,755
)
(
16.7
)
Net sales before chan
g
es in deferred net revenue 802,333 100.0% 888,652 100.0 %
(
86,319
)
(
9.7
)
Chan
g
es in deferred net revenue
(
137,075
)
10,485
(
147,560
)
(
1,407.3
)
Consolidated net sales $ 665,258 $ 899,137 $
(
233,879
)
(
26.0
)
%
Net sales in North America decreased $30.6 million in fiscal 2011 compared to fiscal 2010. The decrease was primarily due to:
• a decrease in net sales from UFC Undisputed 2010 in fiscal 2011 compared to UFC 2009 Undisputed in fiscal 2010,
resulting from fewer units sold and a lower average net selling price;
• a decrease in units sold of games based on kids movie-based licensed games, which was primarily because in fiscal 2011
we did not release any new titles based on the Disney•Pixar brand; and
• a decrease in net sales of games based on our owned intellectual properties, due to titles released throughout fiscal 2010
such as Darksiders, Drawn to Life: The Next Chapter, MX vs. ATV Reflex, and Red Faction: Guerrilla, compared to net
sales from the late fiscal 2011 release of Homefront.
These decreases were partially offset by net sales of uDraw and net sales of games based on new licensed properties.
Net sales in Europe decreased $51.9 million in fiscal 2011 compared to fiscal 2010. The decrease was primarily due to:
• a decrease in units sold of games based on kids movie-based licensed games, which was primarily because in fiscal 2011
we did not release any new titles based on the Disney•Pixar brand;