THQ 2012 Annual Report Download - page 27
Download and view the complete annual report
Please find page 27 of the 2012 THQ annual report below. You can navigate through the pages in the report by either clicking on the pages listed below, or by using the keyword search tool below to find specific information within the annual report.-
 1
1 -
2
-
3
-
4
-
5
-
6
-
7
-
8
-
9
-
10
-
11
-
12
-
13
-
14
-
15
-
16
-
 17
17 -
 18
18 -
 19
19 -
 20
20 -
 21
21 -
 22
22 -
 23
23 -
 24
24 -
 25
25 -
 26
26 -
 27
27 -
 28
28 -
 29
29 -
 30
30 -
 31
31 -
 32
32 -
 33
33 -
 34
34 -
 35
35 -
 36
36 -
 37
37 -
38
-
39
-
40
-
41
-
42
-
43
-
44
-
45
-
46
-
47
-
48
-
49
-
50
-
51
-
52
-
53
-
54
-
55
-
56
-
57
-
58
-
59
-
60
-
61
-
62
-
63
-
64
-
65
-
66
-
67
-
68
-
69
-
70
-
71
-
72
-
73
-
74
-
75
-
76
-
77
-
78
-
79
-
80
-
81
-
82
-
83
-
84
-
85
-
86
-
87
-
88
-
89
-
90
-
91
-
92
-
93
-
94
-
95
-
96
-
97
-
98
-
99
-
100
 |
 |

19
PART II
Item 5. Market for Registrant's Common Equity, Related Stockholder Matters and Issuer Purchases of Equity
Securities
THQ's common stock is listed on the NASDAQ Global Select Market under the symbol "THQI." The following table sets forth,
for the periods indicated, the high and low intraday sales prices of our common stock as reported by the NASDAQ Global
Select Market:
Sales Prices
Hi
g
h Low
Fiscal Year Ended March 31, 2012
Fourth Quarter ended March 31, 2012 $ 0.86 $ 0.48
Third Quarter ended Decembe
r
31, 2011 2.51 0.67
Second Quarter ended Se
p
tembe
r
30, 2011 3.60 1.61
First Quarter ended June 30, 2011 4.87 3.29
Fiscal Year Ended March 31, 2011
Fourth Quarter ended March 31, 2011 $ 6.53 $ 4.25
Third Quarter ended Decembe
r
31, 2010 6.39 3.86
Second Quarter ended Se
p
tembe
r
30, 2010 5.02 3.33
First Quarter ended June 30, 2010 8.29 4.03
The last reported price of our common stock on June 1, 2012, as reported by NASDAQ Global Select Market, was $0.65 per
share.
On January 25, 2012, we received a written notification from Nasdaq notifying us that we fail to comply with Nasdaq's
Marketplace Rule 5450(a)(1) (the “Rule”) because the bid price for our common stock, over the last 30 consecutive business
days, has closed below the minimum $1.00 per share requirement for continued listing. The notification had no immediate
effect on the listing of our common stock (see "Nasdaq Notice" included in the "Business Trends" section of Item 7 for further
discussion).
Holders
As of June 1, 2012 there were approximately 284 holders of record of our common stock.
Dividend Policy
We have never paid cash dividends on our common stock. We currently intend to retain future earnings, if any, to finance the
growth and development of our business and, therefore, we do not anticipate paying any cash dividends in the foreseeable
future. Additionally, our Credit Agreement and Security Agreement with Wells Fargo Capital Finance, LLC restricts our ability
to issue cash dividends (see "Note 9 — Debt" in the notes to the consolidated financial statements included in Item 8).
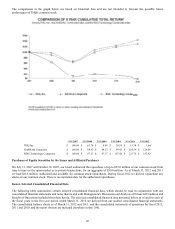
Stock Price Performance Graph
The following stock price performance information shall not be deemed to be "filed" with the Securities and Exchange
Commission nor shall this information be incorporated by reference into any future filing under the Securities Act of 1933, as
amended, or the Securities Exchange Act of 1934, as amended, except to the extent that we specifically incorporate it by
reference into a filing.
The following graph shows a five-year comparison of cumulative total stockholder returns for the period from March 31, 2007
through March 31, 2012, for the Company's common stock, NASDAQ Global Select Market Composite Index and the RDG
Technology Index. The comparison assumes an initial investment of $100 in each on March 31, 2007. We have not paid any
cash dividends and, therefore, the cumulative total return calculation is based solely upon stock price movement and not upon
reinvestment of cash dividends.