THQ 2012 Annual Report Download - page 36
Download and view the complete annual report
Please find page 36 of the 2012 THQ annual report below. You can navigate through the pages in the report by either clicking on the pages listed below, or by using the keyword search tool below to find specific information within the annual report.-
 1
1 -
2
-
3
-
4
-
5
-
6
-
7
-
8
-
9
-
10
-
11
-
12
-
13
-
14
-
15
-
16
-
17
-
18
-
19
-
20
-
21
-
22
-
23
-
24
-
25
-
 26
26 -
 27
27 -
 28
28 -
 29
29 -
 30
30 -
 31
31 -
 32
32 -
 33
33 -
 34
34 -
 35
35 -
 36
36 -
 37
37 -
 38
38 -
 39
39 -
 40
40 -
 41
41 -
 42
42 -
 43
43 -
 44
44 -
 45
45 -
 46
46 -
47
-
48
-
49
-
50
-
51
-
52
-
53
-
54
-
55
-
56
-
57
-
58
-
59
-
60
-
61
-
62
-
63
-
64
-
65
-
66
-
67
-
68
-
69
-
70
-
71
-
72
-
73
-
74
-
75
-
76
-
77
-
78
-
79
-
80
-
81
-
82
-
83
-
84
-
85
-
86
-
87
-
88
-
89
-
90
-
91
-
92
-
93
-
94
-
95
-
96
-
97
-
98
-
99
-
100
 |
 |

28
Restructuring
Restructuring charges generally include costs such as, severance and other employee-based charges in excess of standard
business practices, costs associated with lease abandonments less estimates of sublease income, charges related to long-lived
assets, and costs of other non-cancellable contracts. In fiscal 2012, restructuring charges and adjustments were $6.8 million.
For further information related to our realignment plans and charges and the events and decisions that gave rise to such charges,
see "Note 8— Restructuring and Other Charges" in the notes to the consolidated financial statements included in Part II, Item 8.
In fiscal 2011, restructuring charges and adjustments were minimal and reflected facility-related charges and adjustments due to
changes in actual and estimated sublease income related to our fiscal 2009 realignment.
Interest and Other Income (Expense), net
Interest and other income (expense), net, consists of interest earned on our investments, gains and losses resulting from
exchange rate changes for transactions denominated in currencies other than the functional currency, and interest expense, net
of capitalization and amortization of debt issuance costs on our $100.0 million 5% convertible senior notes (“Notes”) and our
Credit Agreement and Security Agreement (collectively, the “Credit Facility”) with Wells Fargo Capital Finance, LLC. For
further discussion of the Notes and the Credit Facility, see "Note 9— Debt" in the notes to the consolidated financial
statements included in Part II, Item 8.
Interest and other income (expense), net in fiscal 2012 was income of $5.1 million and primarily consisted of foreign currency
gains and a gain recognized from the March 2012 sale of our value PC product line. Interest and other income (expense), net
for fiscal 2011 was income of $0.5 million and primarily represented foreign currency gains and interest income.
Substantially all interest expense for fiscal 2012 and fiscal 2011 was capitalized to software development. (See "Note 21 —
Quarterly Financial Data (Unaudited)" in the notes to the consolidated financial statements included in Item 8 for further
discussion of our capitalization of interest expense on our Notes.)
Income Taxes
Income tax expense for fiscal 2012 was $5.5 million compared to $0.9 million in fiscal 2011. Income tax expense in all periods
relates primarily to income earned in foreign jurisdictions, which is not reduced by carryforward losses generated in the U.S.
The increase in income tax expense is primarily due to $3.5 million of valuation allowances recorded in fiscal 2012 for deferred
tax assets of entities in foreign jurisdictions which we are closing. Additionally, fiscal 2011 tax expense was offset by a
$1.6 million benefit related to the recognition of previously unrecognized tax benefits. The effective tax rate differs
significantly from the federal statutory rate primarily due to taxable losses in the U.S., and certain foreign jurisdictions, which
are fully offset by a valuation allowance.
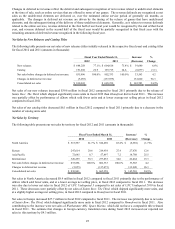
Comparison of Fiscal 2011 to Fiscal 2010
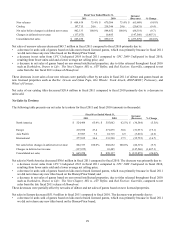
Net Sales
Our net sales were principally derived from sales of interactive software games designed for play on video game consoles,
handheld devices and PCs, including digitally via the Internet, and from sales of uDraw. The following table presents our net
sales before changes in deferred net revenue and adjusts those amounts by the changes in deferred net revenue to arrive at
consolidated net sales as presented in our statements of operations for fiscal 2011 and fiscal 2010 (amounts in thousands):
Fiscal Year Ended March 31, Increase/
(
Decrease
)
% Chan
g
e 2011 2010
Net sales before chan
g
es in deferred net revenue $ 802,333 120.6% $ 888,652 98.8 % $
(
86,319
)
(
9.7
)
%
Chan
g
es in deferred net revenue
(
137,075
)
(
20.6
)
10,485 1.2
(
147,560
)
(
1,407.3
)
Consolidated net sales $ 665,258 100.0% $ 899,137 100.0 % $
(
233,879
)
(
26.0
)
%
Fiscal 2011 net sales before changes in deferred net revenue were primarily driven by Homefront, WWE SmackDown vs. Raw
2011, UFC Undisputed 2010, uDraw, and our catalog titles.
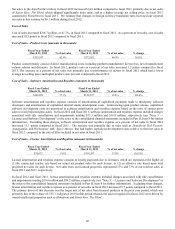
Net Sales by New Releases and Catalog Titles
The following table presents our net sales of new releases and catalog titles for fiscal 2011 and fiscal 2010 (amounts in
thousands):