THQ 2012 Annual Report Download - page 35
Download and view the complete annual report
Please find page 35 of the 2012 THQ annual report below. You can navigate through the pages in the report by either clicking on the pages listed below, or by using the keyword search tool below to find specific information within the annual report.-
 1
1 -
2
-
3
-
4
-
5
-
6
-
7
-
8
-
9
-
10
-
11
-
12
-
13
-
14
-
15
-
16
-
17
-
18
-
19
-
20
-
21
-
22
-
23
-
24
-
 25
25 -
 26
26 -
 27
27 -
 28
28 -
 29
29 -
 30
30 -
 31
31 -
 32
32 -
 33
33 -
 34
34 -
 35
35 -
 36
36 -
 37
37 -
 38
38 -
 39
39 -
 40
40 -
 41
41 -
 42
42 -
 43
43 -
 44
44 -
 45
45 -
46
-
47
-
48
-
49
-
50
-
51
-
52
-
53
-
54
-
55
-
56
-
57
-
58
-
59
-
60
-
61
-
62
-
63
-
64
-
65
-
66
-
67
-
68
-
69
-
70
-
71
-
72
-
73
-
74
-
75
-
76
-
77
-
78
-
79
-
80
-
81
-
82
-
83
-
84
-
85
-
86
-
87
-
88
-
89
-
90
-
91
-
92
-
93
-
94
-
95
-
96
-
97
-
98
-
99
-
100
 |
 |

27
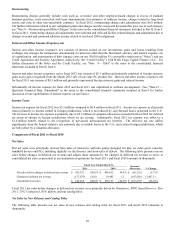
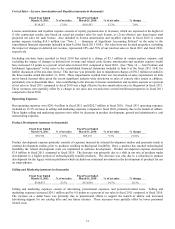
Operating Expenses
Our operating expenses increased $55.3 million, or 19.7% in fiscal 2012 compared to fiscal 2011.
Product Development (amounts in thousands)
Fiscal Year Ended
March 31, 2012 % of net sales
Fiscal Year Ended
March 31, 2011 % of net sales % chan
g
e
$89,526 10.8% $79,374 11.9% 12.8%
Product development expense primarily consists of expenses incurred by internal development studios and payments made to
external development studios which are not eligible, or are in a phase of development that is not yet able to be capitalized as
part of software development. Product development expense increased $10.2 million in fiscal 2012 compared to fiscal 2011.
Included in fiscal 2012 and 2011 was $12.3 million and $1.7 million, respectively, of cash severance charges and other
employee-based costs recorded related to our business realignments (see "Note 8— Restructuring and Other Charges" in the
notes to the consolidated financial statements included in Part II, Item 8). Excluding these charges, product development
expense decreased $0.4 million in fiscal 2012 compared to fiscal 2011. The decrease in fiscal 2012 reflected a reduction in
expenditures resulting from our studio closures and a reduction in the number of games under development; these decreases
were partially offset by changes in the timing of our development cycles as more of our games during fiscal 2012 were in a
phase of development that was not capitalizable to software development compared to fiscal 2011.
Selling and Marketing (amounts in thousands)
Fiscal Year Ended
March 31, 2012 % of net sales
Fiscal Year Ended
March 31, 2011 % of net sales % chan
g
e
$191,669 23.1% $156,075 23.5% 22.8%
Selling and marketing expenses consist of advertising, promotional expenses, and personnel-related costs. Selling and
marketing expenses increased $35.6 million in fiscal 2012 compared to fiscal 2011.
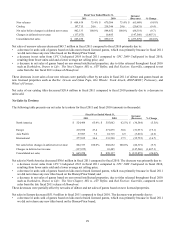
Included in fiscal 2012 and 2011 was $3.2 million and $0.2 million, respectively, of cash severance charges and other
employee-based costs recorded related to our business realignments (see "Note 8— Restructuring and Other Charges" in the
notes to the consolidated financial statements included in Part II, Item 8). Excluding these charges, selling and marketing
expenses increased $32.6 million in fiscal 2012 compared to fiscal 2011; this increase was primarily due to promotional efforts
supporting the launch of new releases such as Saints Row: The Third, Warhammer 40,000: Space Marine and Red Faction:
Armageddon in fiscal 2012.
Excluding the impact of changes in deferred net revenue, to arrive at a net sales basis that most closely relates to our selling and
marketing activities in a given period, selling and marketing expenses (excluding cash severance charges and other employee-
based costs recorded related to our business realignments) as a percent of net sales increased 3.1 points in fiscal 2012 compared
to fiscal 2011. The increase in fiscal 2012 was primarily due to the fiscal 2012 release of uDraw, which had higher levels of
marketing support relative to its net sales compared to the uDraw release in fiscal 2011. Additionally, the increase was also due
to higher marketing support for catalog titles on lower net sales from catalog titles in fiscal 2012, compared fiscal 2011.
General and Administrative (amounts in thousands)
Fiscal Year Ended
March 31, 2012 % of net sales
Fiscal Year Ended
March 31, 2011 % of net sales % chan
g
e
$48,712 5.9% $45,356 6.8% 7.4%
General and administrative expenses consist of personnel and related expenses of executive and administrative staff and fees
for professional services such as legal and accounting. Included in fiscal 2012 and 2011 was $2.3 million and $0.4 million,
respectively, of cash severance charges and other employee-based costs recorded related to our business realignments (see
"Note 8— Restructuring and Other Charges" in the notes to the consolidated financial statements included in Part II, Item 8).
Excluding these charges, general and administrative expenses increased $1.4 million in fiscal 2012 compared to fiscal 2011;
this increase was primarily due to recoveries of bad debt in the prior fiscal year.