THQ 2012 Annual Report Download - page 81
Download and view the complete annual report
Please find page 81 of the 2012 THQ annual report below. You can navigate through the pages in the report by either clicking on the pages listed below, or by using the keyword search tool below to find specific information within the annual report.-
 1
1 -
2
-
3
-
4
-
5
-
6
-
7
-
8
-
9
-
10
-
11
-
12
-
13
-
14
-
15
-
16
-
17
-
18
-
19
-
20
-
21
-
22
-
23
-
24
-
25
-
26
-
27
-
28
-
29
-
30
-
31
-
32
-
33
-
34
-
35
-
36
-
37
-
38
-
39
-
40
-
41
-
42
-
43
-
44
-
45
-
46
-
47
-
48
-
49
-
50
-
51
-
52
-
53
-
54
-
55
-
56
-
57
-
58
-
59
-
60
-
61
-
62
-
63
-
64
-
65
-
66
-
67
-
68
-
69
-
70
-
 71
71 -
 72
72 -
 73
73 -
 74
74 -
 75
75 -
 76
76 -
 77
77 -
 78
78 -
 79
79 -
 80
80 -
 81
81 -
 82
82 -
 83
83 -
 84
84 -
 85
85 -
 86
86 -
 87
87 -
 88
88 -
 89
89 -
 90
90 -
 91
91 -
92
-
93
-
94
-
95
-
96
-
97
-
98
-
99
-
100
 |
 |

73
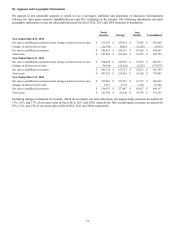
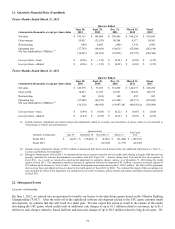
20. Segment and Geographic Information
We operate in one reportable segment in which we are a developer, publisher and distributor of interactive entertainment
software for video game consoles, handheld devices and PCs, including via the Internet. The following information sets forth
geographic information on our net sales and total assets for fiscal 2012, 2011 and 2010 (amounts in thousands):
North
America Euro
p
e
Asia
Pacific Consolidated
Year Ended March 31, 2012
Net sales to unaffiliated customers before chan
g
es in deferred net revenue $ 515,597 $ 247,614 $ 72,685 $ 835,896
Chan
g
es in deferred net revenue
(
10,744
)
10,918
(
5,229
)
(
5,055
)
Net sales to unaffiliated customers $ 504,853 $ 258,532 $ 67,456 $ 830,841
Total assets $ 183,589 $ 163,498 $ 45,707 $ 392,794
Year Ended March 31, 2011
Net sales to unaffiliated customers before chan
g
es in
d
eferred net revenue $ 524,498 $ 219,938 $ 57,897 $ 802,333
Chan
g
es in deferred net revenue
(
79,364
)
(
52,426
)
(
5,285
)
(
137,075
)
Net sales to unaffiliated customers $ 445,134 $ 167,512 $ 52,612 $ 665,258
Total assets $ 497,214 $ 223,683 $ 53,508 $ 774,405
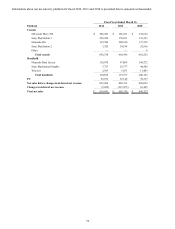
Year Ended March 31, 2010
Net sales to unaffiliated customers before chan
g
es in deferred net revenue $ 555,062 $ 271,875 $ 61,715 $ 888,652
Chan
g
es in deferred net revenue 3,611 5,772 1,102 10,485
Net sales to unaffiliated customers $ 558,673 $ 277,647 $ 62,817 $ 899,137
Total assets $ 581,790 $ 93,836 $ 38,703 $ 714,329
Excluding changes in deferred net revenue, which do not impact our cash collections, our largest single customer accounted for
17%, 18%, and 17% of our gross sales in fiscal 2012, 2011 and 2010, respectively. Our second largest customer accounted for
10%, 13%, and 15% of our gross sales in fiscal 2012, 2011 and 2010, respectively.