THQ 2012 Annual Report Download - page 75
Download and view the complete annual report
Please find page 75 of the 2012 THQ annual report below. You can navigate through the pages in the report by either clicking on the pages listed below, or by using the keyword search tool below to find specific information within the annual report.-
 1
1 -
2
-
3
-
4
-
5
-
6
-
7
-
8
-
9
-
10
-
11
-
12
-
13
-
14
-
15
-
16
-
17
-
18
-
19
-
20
-
21
-
22
-
23
-
24
-
25
-
26
-
27
-
28
-
29
-
30
-
31
-
32
-
33
-
34
-
35
-
36
-
37
-
38
-
39
-
40
-
41
-
42
-
43
-
44
-
45
-
46
-
47
-
48
-
49
-
50
-
51
-
52
-
53
-
54
-
55
-
56
-
57
-
58
-
59
-
60
-
61
-
62
-
63
-
64
-
 65
65 -
 66
66 -
 67
67 -
 68
68 -
 69
69 -
 70
70 -
 71
71 -
 72
72 -
 73
73 -
 74
74 -
 75
75 -
 76
76 -
 77
77 -
 78
78 -
 79
79 -
 80
80 -
 81
81 -
 82
82 -
 83
83 -
 84
84 -
 85
85 -
86
-
87
-
88
-
89
-
90
-
91
-
92
-
93
-
94
-
95
-
96
-
97
-
98
-
99
-
100
 |
 |

67
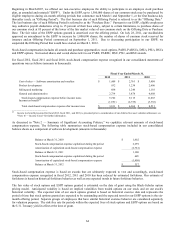
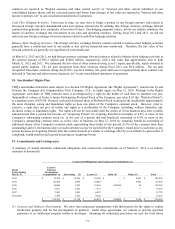
Grants outside of a stockholder-approved plan. On May 25, 2012, we appointed Jason Rubin as our President and Jason Kay
as our Chief Strategy Officer. As inducements to their employment, both were granted certain stock awards outside of a
stockholder-approved plan and pursuant to the “Employment Inducement Awards” exemption of the Nasdaq Listing Rules (see
"Note 22 — Subsequent Events").
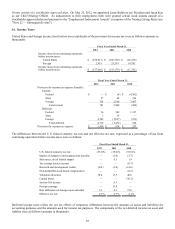
16. Income Taxes
United States and foreign income (loss) before taxes and details of the provision for income tax were as follows (amounts in
thousands):
Fiscal Year Ended March 31,
2012 2011 2010
Income (loss) from continuing operations
b
efore income taxes:
United States $
(
239,921
)
$
(
160,709
)
$
(
26,470
)
Forei
g
n 2,915 25,539 14,765
Income (loss) from continuing operations
b
efore income taxes $
(
237,006
)
$
(
135,170
)
$
(
11,705
)
Fiscal Year Ended March 31,
2012 2011 2010
Provision for income tax ex
p
ense
(
benefit
)
:
Current:
Federal $
—
$
(
4
)
$
(
4,302
)
State 57 44 316
Forei
g
n 724 2,360 3,487
Total current 781 2,400
(
499
)
Deferred:
Federal 16 309 1,337
State 1 36
—
Forei
g
n 4,702
(
1,817
)
(
591
)
Total deferre
d
4,719
(
1,472
)
746
Provision for income tax ex
p
ense $ 5,500 $ 928 $ 247
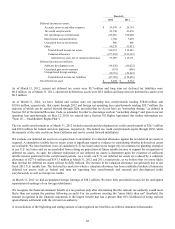
The differences between the U.S. federal statutory tax rate and our effective tax rate, expressed as a percentage of loss from
continuing operations before income taxes were as follows:
Fiscal Year Ended March 31,
2012 2011 2010
U.S. federal statutor
y
tax rate
(
35.0
)
%
(
35.0
)
%
(
35.0
)
%
Im
p
act of chan
g
es in unreco
g
nized tax benefits
—
(
1.0
)
(
2.7
)
State taxes, net of federal im
p
act
—
0.1 1.8
Tax exem
p
t interest income
—
—
(
0.7
)
Research and develo
p
ment credits
(
0.4
)
(
1.0
)
(
14.6
)
Non-deductible stoc
k
-
b
ased com
p
ensation
—
—
(
0.2
)
Valuation allowance 34.4 17.5 46.0
Ca
p
ital losses
—
—
(
30.1
)
Section 956 income
—
6.1
—
Forei
g
n earnin
g
s
—
13.9
—
Rate differences in forei
g
n taxes and othe
r
3.3 0.1 37.6
Effective tax rate 2.3 % 0.7 % 2.1 %
Deferred income taxes reflect the net tax effects of temporary differences between the amounts of assets and liabilities for
accounting purposes and the amounts used for income tax purposes. The components of the net deferred income tax asset and
liability were as follows (amounts in thousands):