THQ 2012 Annual Report Download - page 38
Download and view the complete annual report
Please find page 38 of the 2012 THQ annual report below. You can navigate through the pages in the report by either clicking on the pages listed below, or by using the keyword search tool below to find specific information within the annual report.-
 1
1 -
2
-
3
-
4
-
5
-
6
-
7
-
8
-
9
-
10
-
11
-
12
-
13
-
14
-
15
-
16
-
17
-
18
-
19
-
20
-
21
-
22
-
23
-
24
-
25
-
26
-
27
-
 28
28 -
 29
29 -
 30
30 -
 31
31 -
 32
32 -
 33
33 -
 34
34 -
 35
35 -
 36
36 -
 37
37 -
 38
38 -
 39
39 -
 40
40 -
 41
41 -
 42
42 -
 43
43 -
 44
44 -
 45
45 -
 46
46 -
 47
47 -
 48
48 -
49
-
50
-
51
-
52
-
53
-
54
-
55
-
56
-
57
-
58
-
59
-
60
-
61
-
62
-
63
-
64
-
65
-
66
-
67
-
68
-
69
-
70
-
71
-
72
-
73
-
74
-
75
-
76
-
77
-
78
-
79
-
80
-
81
-
82
-
83
-
84
-
85
-
86
-
87
-
88
-
89
-
90
-
91
-
92
-
93
-
94
-
95
-
96
-
97
-
98
-
99
-
100
 |
 |

30
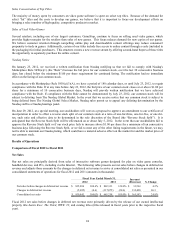
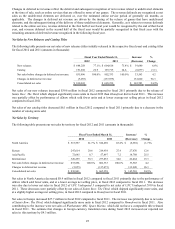
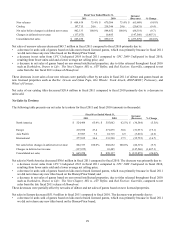
• a decrease in net sales of games based on our owned intellectual properties, due to titles released throughout fiscal 2010
such as Darksiders, Drawn to Life: The Next Chapter, MX vs. ATV Reflex, and Red Faction: Guerrilla, compared to net
sales from the late fiscal 2011 release of Homefront;
• a decrease in net sales from UFC Undisputed 2010 in fiscal 2011 compared to UFC 2009 Undisputed in fiscal 2010,
resulting from fewer units sold and a lower average net selling price; and
• a decrease in units sold of games based on the WWE license.
These decreases were partially offset by net sales of uDraw. We estimate that changes in foreign currency translation rates
during fiscal 2011 decreased reported net sales in Europe by $4.8 million.
Net sales in the Asia Pacific territories decreased $3.8 million in fiscal 2011 compared to fiscal 2010 primarily due to a
decrease in units sold of games based on our owned intellectual properties and games based on the WWE brand. These
decreases were partially offset by increases in net sales from distribution arrangements. We estimate that changes in foreign
currency translation rates during fiscal 2011 increased reported net sales in this territory by $5.5 million.
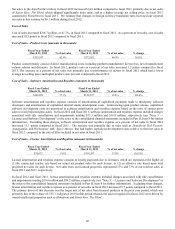
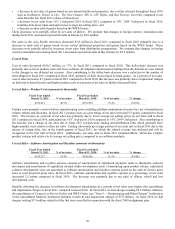
Cost of Sales
Cost of sales decreased $106.5 million, or 17%, in fiscal 2011 compared to fiscal 2010. This dollar-basis decrease was
primarily due to lower product costs and lower software development amortization resulting from the deferral of costs related
to the changes in our deferred net revenue. Also contributing to the dollar-basis decrease was a reduction in the number of
units shipped in fiscal 2011 compared to fiscal 2010, primarily of kids' movie-based licensed games. As a percent of net sales,
cost of sales increased 8.5 points in fiscal 2011 compared to fiscal 2010; this increase was primarily due to impairment charges
on kids movie-based licenses and higher product costs as a percent of net sales as further discussed below.
Cost of Sales—Product Costs (amounts in thousands)
Fiscal Year Ended
March 31, 2011 % of net sales
Fiscal Year Ended
March 31, 2010 % of net sales % chan
g
e
$272,021 40.9% $318,590 35.4%
(
14.6
)
%
Product costs primarily consist of direct manufacturing costs, including platform manufacturer license fees, net of manufacturer
volume rebates and discounts. In fiscal 2011, product costs as a percentage of net sales increased 5.5 points compared to fiscal
2010. The increase as a percent of net sales was primarily due to lower average net selling prices on our titles sold in fiscal
2011 compared to fiscal 2010, particularly on UFC Undisputed 2010 compared to UFC 2009 Undisputed. Also contributing to
the increase was a change in our sales mix in fiscal 2011 towards more catalog and distribution titles which generally have
higher product costs relative to their net sales. Catalog titles made up a larger portion of our sales mix in fiscal 2011 due to the
release of certain titles, late in the fourth quarter of fiscal 2011, for which the related revenue was deferred and will be
recognized in the first half of fiscal 2012. Additionally, our sales mix in fiscal 2011 included uDraw, which has a higher
product cost per unit relative to its average net selling price, compared to our software products.
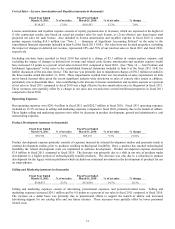
Cost of Sales—Software Amortization and Royalties (amounts in thousands)
Fiscal Year Ended
March 31, 2011 % of net sales
Fiscal Year Ended
March 31, 2010 % of net sales % chan
g
e
$129,237 19.4% $196,956 21.9%
(
34.4
)
%
Software amortization and royalties expense consists of amortization of capitalized payments made to third-party software
developers and amortization of capitalized internal studio development costs. Commencing upon product release, capitalized
software development costs are amortized to software amortization and royalties expense based on the ratio of current gross
sales to total projected gross sales. In fiscal 2011, software amortization and royalties expense as a percentage of net sales
decreased 2.5 points compared to fiscal 2010. The decrease was primarily due to net sales of uDraw, which had low
development costs.
Partially offsetting the decrease in software development amortization as a percent of net sales were higher title cancellation
and impairment charges in fiscal 2011 compared to fiscal 2010. In fiscal 2011 we had charges totaling $9.9 million related to
the cancellation of Company of Heroes Online and WWE Online (see "Note 8 — Restructuring and Other Charges" in the notes
to the consolidated financial statements included in Item 8) and impairment charges of $7.0 million. In fiscal 2010 we had
charges totaling $7.9 million related to titles that were cancelled in connection with the fiscal 2009 realignment plan.