THQ 2012 Annual Report Download - page 58
Download and view the complete annual report
Please find page 58 of the 2012 THQ annual report below. You can navigate through the pages in the report by either clicking on the pages listed below, or by using the keyword search tool below to find specific information within the annual report.-
 1
1 -
2
-
3
-
4
-
5
-
6
-
7
-
8
-
9
-
10
-
11
-
12
-
13
-
14
-
15
-
16
-
17
-
18
-
19
-
20
-
21
-
22
-
23
-
24
-
25
-
26
-
27
-
28
-
29
-
30
-
31
-
32
-
33
-
34
-
35
-
36
-
37
-
38
-
39
-
40
-
41
-
42
-
43
-
44
-
45
-
46
-
47
-
 48
48 -
 49
49 -
 50
50 -
 51
51 -
 52
52 -
 53
53 -
 54
54 -
 55
55 -
 56
56 -
 57
57 -
 58
58 -
 59
59 -
 60
60 -
 61
61 -
 62
62 -
 63
63 -
 64
64 -
 65
65 -
 66
66 -
 67
67 -
 68
68 -
69
-
70
-
71
-
72
-
73
-
74
-
75
-
76
-
77
-
78
-
79
-
80
-
81
-
82
-
83
-
84
-
85
-
86
-
87
-
88
-
89
-
90
-
91
-
92
-
93
-
94
-
95
-
96
-
97
-
98
-
99
-
100
 |
 |
50
For further information, see "Note 3— Accounts Receivable Allowances."
Concentrations of Credit Risk. Financial instruments which potentially subject us to concentration of credit risk generally
consist principally of cash and cash equivalents, short-term investments, accounts receivable, and long-term investments. We
place cash and cash equivalents and short-term investments with high credit-quality financial institutions and limit the amount
of credit exposure to any one financial institution. We believe the risk related to cash and cash equivalents, and accounts
receivable is not material due to the short-term nature of such assets.
Most of our sales are made directly to mass merchandisers and national retailers. Due to the increased volume of sales to these
channels, we have experienced an increased concentration of credit risk, and as a result, may maintain individually significant
receivable balances with such mass merchandisers and national retailers. We perform ongoing credit evaluations of our
customers, maintain an allowance for potential credit losses, and most of our foreign receivables are covered by credit
insurance. As of March 31, 2012 and 2011, 15% of our gross accounts receivable outstanding was with one major customer.
Excluding changes in deferred net revenue, which do not impact our cash collections, our largest single customer accounted for
17%, 18%, and 17% of our gross sales in fiscal 2012, fiscal 2011, and fiscal 2010, respectively; and our second largest
customer accounted for 10%, 13%, and 15% of our gross sales in fiscal 2012, fiscal 2011, and fiscal 2010, respectively.
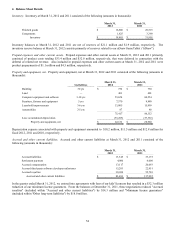
Inventory. Inventory, which consists principally of finished products, is stated at the lower of cost (moving weighted average)
or market. We estimate the net realizable value of slow-moving inventory on a title by title basis, and charge the excess of cost
over net realizable value to "Cost of sales — Product costs" in our consolidated statements of operations.
Property and Equipment. Property and equipment are recorded at cost. Depreciation is computed using the straight-line
method over the estimated useful lives of the assets. Leasehold improvements are depreciated over the shorter of their useful
lives or the remaining lease term.
Licenses. Minimum guaranteed royalty payments for intellectual property licenses are initially recorded on our consolidated
balance sheets as an asset (licenses) and as a liability (accrued royalties) at the contractual amount upon execution of the
contract if no significant performance obligation remains with the licensor. When a significant performance obligation remains
with the licensor, we record royalty payments as an asset (licenses) and as a liability (accrued royalties) when payable rather
than upon execution of the contract. Royalty payments for intellectual property licenses are classified as current assets and
current liabilities to the extent such royalty payments relate to anticipated product sales during the subsequent year and long-
term assets and long-term liabilities if such royalty payments relate to anticipated product sales after one year. Licenses are
expensed to "Cost of sales — License amortization and royalties" in our consolidated statements of operations at the higher of
(i) the contractual royalty rate based on actual net product sales related to such license, or (ii) an effective rate based upon total
projected net sales related to such license.
Software Development. We utilize both internal development teams and third-party software developers to develop our
software. We capitalize software development costs once technological feasibility is established and we determine that such
costs are recoverable against future net sales. We evaluate technological feasibility on a product-by-product basis. For
products where proven game engine technology exists, the establishment of technological feasibility may occur early in the
development cycle. Once technological feasibility is established, we capitalize the milestone payments made to third-party
software developers and the direct payroll and overhead costs for our internal development teams. Amounts related to software
development for which technological feasibility is not yet met are charged as incurred to “Product development” expense in our
consolidated statements of operations. Commencing upon product release, capitalized software development costs are
amortized to "Cost of sales — Software amortization and royalties" in our consolidated statements of operations based on the
ratio of current gross sales to total projected gross sales. In addition, we have established profit based internal royalty programs
that provide for certain of our employees to participate in the success of software titles that they assist in developing after the
titles achieve certain internal profit targets. Royalties earned by employees under this program are recorded as "Cost of sales —
Software amortization and royalties" as they are incurred.
Licenses and Software Development Impairment Analysis. We evaluate the future recoverability of our capitalized licenses and
software development on a quarterly basis in connection with the preparation of our financial statements. In this evaluation, we
compare the carrying value of such capitalized costs to their net realizable value, on a product-by-product basis. The net
realizable value is determined using Level 3 inputs, specifically, the estimated future net sales from the product, reduced by the
estimated future direct costs associated with the product such as completion costs, cost of sales and selling and marketing
expenses. Net sales inputs are developed using recent internal sales performance for similar titles, adjusted for current market
trends and comparable products. As certain of our licenses extend for multiple products over multiple years, we also assess the
recoverability of capitalized license costs based on certain qualitative factors such as the success of other products and/or
entertainment vehicles utilizing the intellectual property, whether there are any future planned theatrical releases or television
series based on the intellectual property and the rights holder's continued promotion and exploitation of the intellectual