TCF Bank 2012 Annual Report Download - page 99
Download and view the complete annual report
Please find page 99 of the 2012 TCF Bank annual report below. You can navigate through the pages in the report by either clicking on the pages listed below, or by using the keyword search tool below to find specific information within the annual report.-
 1
1 -
2
-
3
-
4
-
5
-
6
-
7
-
8
-
9
-
10
-
11
-
12
-
13
-
14
-
15
-
16
-
17
-
18
-
19
-
20
-
21
-
22
-
23
-
24
-
25
-
26
-
27
-
28
-
29
-
30
-
31
-
32
-
33
-
34
-
35
-
36
-
37
-
38
-
39
-
40
-
41
-
42
-
43
-
44
-
45
-
46
-
47
-
48
-
49
-
50
-
51
-
52
-
53
-
54
-
55
-
56
-
57
-
58
-
59
-
60
-
61
-
62
-
63
-
64
-
65
-
66
-
67
-
68
-
69
-
70
-
71
-
72
-
73
-
74
-
75
-
76
-
77
-
78
-
79
-
80
-
81
-
82
-
83
-
84
-
85
-
86
-
87
-
88
-
 89
89 -
 90
90 -
 91
91 -
 92
92 -
 93
93 -
 94
94 -
 95
95 -
 96
96 -
 97
97 -
 98
98 -
 99
99 -
 100
100 -
 101
101 -
 102
102 -
 103
103 -
 104
104 -
 105
105 -
 106
106 -
 107
107 -
 108
108 -
 109
109 -
110
-
111
-
112
-
113
-
114
-
115
-
116
-
117
-
118
-
119
-
120
-
121
-
122
-
123
-
124
-
125
-
126
-
127
-
128
-
129
-
130
-
131
-
132
-
133
-
134
-
135
-
136
-
137
-
138
-
139
-
140
-
141
-
142
 |
 |

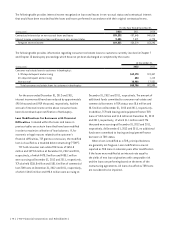
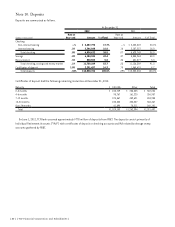
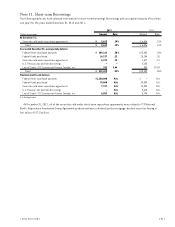
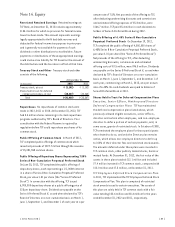
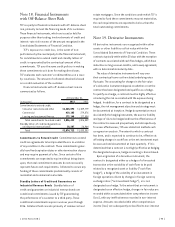
governing the Trust Preferred Securities), which allowed
TCF to redeem the Trust Preferred Securities. The Trust
Preferred Securities were redeemed on July 30, 2012, at
the redemption price of $25 per Trust Preferred Security
plus accumulated and unpaid distributions, totaling
$115 million. The redemption was funded with a portion of the
net proceeds from TCF’s offering of Series A Non-Cumulative
Perpetual Preferred Stock, which closed in June 2012.
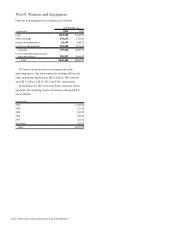
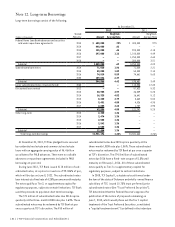
During March 2012, as part of TCF’s balance sheet
repositioning, the Company borrowed $2.1 billion of
fixed and floating rate FHLB advances, both long-and
short-term, with a weighted-average interest rate of .5%,
and also sold $1.9 billion of U.S. government-sponsored
mortgage-backed securities at a gain of $77 million.
Proceeds were used to terminate $2.1 billion of FHLB
advances with a weighted-average fixed rate of 4.4%, and
$1.5 billion of repurchase agreements with a weighted-
average fixed rate of 4.2%. At December 31, 2012, the
aggregate carrying value of pledged loans available as
collateral for FHLB advances was $6.4 billion. Such loans are
secured by residential real estate, commercial real estate
loans, and FHLB stock.
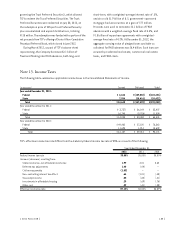
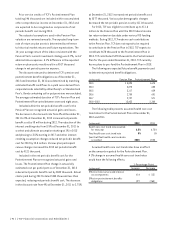
Note 13. Income Taxes
The following table summarizes applicable income taxes in the Consolidated Statements of Income.
(In thousands) Current Deferred Total
Year ended December 31, 2012:
Federal $ 6,646 $(129,082) $(122,436)
State 7,994 (18,416) (10,422)
Total $14,640 $(147,498) $(132,858)
Year ended December 31, 2011:
Federal $ (2,737) $ 56,144 $ 53,407
State 16,740 (5,706) 11,034
Total $ 14,003 $ 50,438 $ 64,441
Year ended December 31, 2010:
Federal $ 49,462 $ 27,100 $ 76,562
State 11,695 1,914 13,609
Total $ 61,157 $ 29,014 $ 90,171
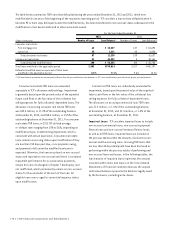
TCF’s effective income tax rate differs from the statutory federal income tax rate of 35% as a result of the following.
Year Ended December 31,
2012 2011 2010
Federal income tax rate 35.00% 35.00% 35.00%
Increase (decrease) resulting from:
State income tax, net of federal income tax 1.99 4.01 3.62
Deferred tax adjustments 1.40 (.04) –
Civil money penalty (1.03) – –
Non-controlling interest tax effect .64 (1.01) (.48)
Tax exempt income .55 (.82) (.41)
Investments in affordable housing .29 (.69) (.76)
Other, net .29 (.41) (.08)
Effective income tax rate 39.13% 36.04% 36.89%
{ 2012 Form 10K } { 83 }