TCF Bank 2012 Annual Report Download - page 64
Download and view the complete annual report
Please find page 64 of the 2012 TCF Bank annual report below. You can navigate through the pages in the report by either clicking on the pages listed below, or by using the keyword search tool below to find specific information within the annual report.-
 1
1 -
2
-
3
-
4
-
5
-
6
-
7
-
8
-
9
-
10
-
11
-
12
-
13
-
14
-
15
-
16
-
17
-
18
-
19
-
20
-
21
-
22
-
23
-
24
-
25
-
26
-
27
-
28
-
29
-
30
-
31
-
32
-
33
-
34
-
35
-
36
-
37
-
38
-
39
-
40
-
41
-
42
-
43
-
44
-
45
-
46
-
47
-
48
-
49
-
50
-
51
-
52
-
53
-
 54
54 -
 55
55 -
 56
56 -
 57
57 -
 58
58 -
 59
59 -
 60
60 -
 61
61 -
 62
62 -
 63
63 -
 64
64 -
 65
65 -
 66
66 -
 67
67 -
 68
68 -
 69
69 -
 70
70 -
 71
71 -
 72
72 -
 73
73 -
 74
74 -
75
-
76
-
77
-
78
-
79
-
80
-
81
-
82
-
83
-
84
-
85
-
86
-
87
-
88
-
89
-
90
-
91
-
92
-
93
-
94
-
95
-
96
-
97
-
98
-
99
-
100
-
101
-
102
-
103
-
104
-
105
-
106
-
107
-
108
-
109
-
110
-
111
-
112
-
113
-
114
-
115
-
116
-
117
-
118
-
119
-
120
-
121
-
122
-
123
-
124
-
125
-
126
-
127
-
128
-
129
-
130
-
131
-
132
-
133
-
134
-
135
-
136
-
137
-
138
-
139
-
140
-
141
-
142
 |
 |
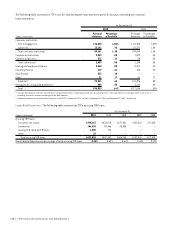
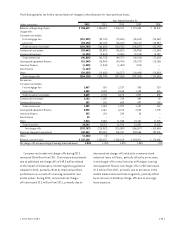
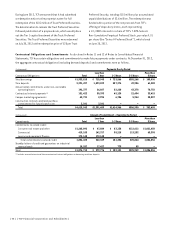
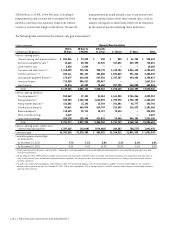
The following table is a reconciliation of the non-GAAP financial measures of tangible realized common equity and tangible
assets to the GAAP measures of total equity and total assets.
At December 31,
(Dollars in thousands) 2012 2011 2010 2009 2008
Computation of tangible realized common equity
to tangible assets:
Total equity $ 1,876,643 $ 1,878,627 $ 1,480,163 $ 1,179,755 $ 1,493,776
Less: Non-controlling interest in subsidiaries 13,270 10,494 8,500 4,393 –
Total TCF Financial Corporation stockholders’ equity 1,863,373 1,868,133 1,471,663 1,175,362 1,493,776
Less:
Preferred stock 263,240 – – – 348,437
Goodwill 225,640 225,640 152,599 152,599 152,599
Other intangibles 8,674 7,134 1,232 1,405 –
Accumulated other comprehensive income 12,443 56,826 – 1,660 23,685
Add:
Accumulated other comprehensive loss –– 15,692 – –
Tangible realized common equity $ 1,353,376 $ 1,578,533 $ 1,333,524 $ 1,019,698 $ 969,055
Total assets $18,225,917 $18,979,388 $18,465,025 $17,885,175 $16,740,357
Less:
Goodwill 225,640 225,640 152,599 152,599 152,599
Other intangibles 8,674 7,134 1,232 1,405 –
Tangible assets $17,991,603 $18,746,614 $18,311,194 $17,731,171 $16,587,758
Tangible realized common equity to tangible assets 7.52% 8.42% 7.28% 5.75% 5.84%
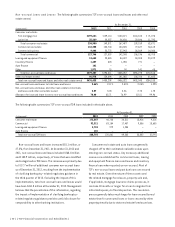
At December 31, 2012 and 2011, regulatory capital for TCF and TCF Bank exceeded their regulatory capital requirements and
were considered “well-capitalized” under guidelines established by the Federal Reserve and the OCC. See Notes 14 and 15 of
Notes to Consolidated Financial Statements.
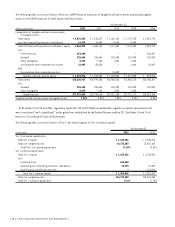
The following table is a reconciliation of Tier 1 risk-based capital to Tier 1 common capital.
At December 31,
(In thousands) 2012 2011
Tier 1 risk-based capital ratio:
Total Tier 1 capital $ 1,633,336 $ 1,706,926
Total risk-weighted assets 14,733,203 13,475,330
Total Tier 1 risk-based capital ratio 11.09% 12.67%
Tier 1 common capital ratio:
Total Tier 1 capital $ 1,633,336 $ 1,706,926
Less:
Preferred stock 263,240 –
Qualifying non-controlling interest in subsidiaries 13,270 10,494
Qualifying trust preferred securities – 115,000
Total Tier 1 common capital $ 1,356,826 $ 1,581,432
Total risk-weighted assets $14,733,203 $13,475,330
Total Tier 1 common capital ratio 9.21% 11.74%
{ 48 } { TCF Financial Corporation and Subsidiaries }