TCF Bank 2012 Annual Report Download - page 52
Download and view the complete annual report
Please find page 52 of the 2012 TCF Bank annual report below. You can navigate through the pages in the report by either clicking on the pages listed below, or by using the keyword search tool below to find specific information within the annual report.-
 1
1 -
2
-
3
-
4
-
5
-
6
-
7
-
8
-
9
-
10
-
11
-
12
-
13
-
14
-
15
-
16
-
17
-
18
-
19
-
20
-
21
-
22
-
23
-
24
-
25
-
26
-
27
-
28
-
29
-
30
-
31
-
32
-
33
-
34
-
35
-
36
-
37
-
38
-
39
-
40
-
41
-
 42
42 -
 43
43 -
 44
44 -
 45
45 -
 46
46 -
 47
47 -
 48
48 -
 49
49 -
 50
50 -
 51
51 -
 52
52 -
 53
53 -
 54
54 -
 55
55 -
 56
56 -
 57
57 -
 58
58 -
 59
59 -
 60
60 -
 61
61 -
 62
62 -
63
-
64
-
65
-
66
-
67
-
68
-
69
-
70
-
71
-
72
-
73
-
74
-
75
-
76
-
77
-
78
-
79
-
80
-
81
-
82
-
83
-
84
-
85
-
86
-
87
-
88
-
89
-
90
-
91
-
92
-
93
-
94
-
95
-
96
-
97
-
98
-
99
-
100
-
101
-
102
-
103
-
104
-
105
-
106
-
107
-
108
-
109
-
110
-
111
-
112
-
113
-
114
-
115
-
116
-
117
-
118
-
119
-
120
-
121
-
122
-
123
-
124
-
125
-
126
-
127
-
128
-
129
-
130
-
131
-
132
-
133
-
134
-
135
-
136
-
137
-
138
-
139
-
140
-
141
-
142
 |
 |
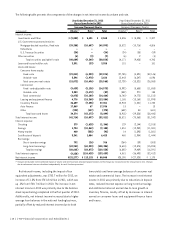
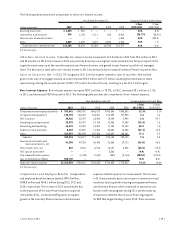
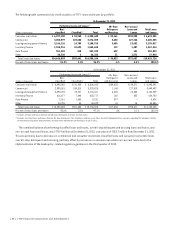
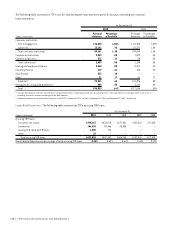
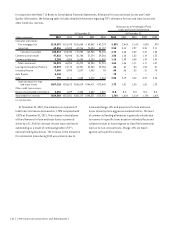
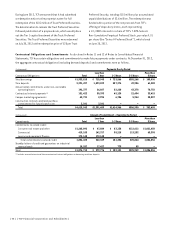
The following table summarizes key credit statistics of TCF’s loans and leases by portfolio.
At December 31, 2012
(Dollars in thousands)
Performing Loans and Leases(1) 60+ Days
Delinquent
and Accruing
Non-accrual
Loans and
Leases
Total Loans
and Leases
Non-
classified Classified(2) Total
Consumer real estate $ 6,297,180 $ 53,260 $ 6,350,440 $ 89,161 $234,900 $ 6,674,501
Commercial 3,050,979 223,880 3,274,859 2,630 127,746 3,405,235
Leasing and equipment finance 3,166,126 14,789 3,180,915 3,450 13,652 3,198,017
Inventory finance 1,554,916 10,692 1,565,608 119 1,487 1,567,214
Auto finance 551,282 818 552,100 632 101 552,833
Other 26,320 2 26,322 31 1,571 27,924
Total loans and leases $14,646,803 $303,441 $14,950,244 $ 96,023 $379,457 $15,425,724
Percent of total loans and leases 94.9% 2.0% 96.9% .6% 2.5 % 100.0%
At December 31, 2011
(Dollars in thousands)
Performing Loans and Leases(1) 60+ Days
Delinquent
and Accruing
Non-accrual
Loans and
Leases
Total Loans
and Leases
Non-
classified Classified(2) Total
Consumer real estate $ 6,495,265 $ 141,020 $ 6,636,285 $109,635 $149,371 $ 6,895,291
Commercial 2,990,515 330,310 3,320,825 1,148 127,519 3,449,492
Leasing and equipment finance 3,093,194 22,227 3,115,421 6,255 20,583 3,142,259
Inventory finance 616,677 7,040 623,717 160 823 624,700
Auto finance 2,181 1,050 3,231 397 – 3,628
Other 34,796 33 34,829 41 15 34,885
Total loans and leases $ 13,232,628 $ 501,680 $ 13,734,308 $117,636 $298,311 $ 14,150,255
Percent of total loans and leases 93.6% 3.5% 97.1% .8% 2.1% 100.0%
(1) Includes all loans and leases that are not 60+ days delinquent or on non-accrual status.
(2) Excludes classified loans and leases that are 60+ days delinquent. Classified loans and leases are those for which management has concerns regarding the borrower’s ability
to meet the existing terms and conditions, but may never become non-performing or result in a loss.
The combined balance of performing classified loans and leases, over 60-day delinquent and accruing loans and leases, and
non-accrual loans and leases, was $778.9 million at December 31, 2012, a decrease of $138.7 million from December 31, 2011.
This was primarily due to decreases in commercial and consumer real estate classified loans and consumer real estate loans
over 60-days delinquent and accruing, partially offset by increases in consumer real estate non-accrual loans due to the
implementation of the bankruptcy-related regulatory guidance in the third quarter of 2012.
{ 36 } { TCF Financial Corporation and Subsidiaries }