TCF Bank 2012 Annual Report Download - page 10
Download and view the complete annual report
Please find page 10 of the 2012 TCF Bank annual report below. You can navigate through the pages in the report by either clicking on the pages listed below, or by using the keyword search tool below to find specific information within the annual report.-
 1
1 -
 2
2 -
 3
3 -
 4
4 -
 5
5 -
 6
6 -
 7
7 -
 8
8 -
 9
9 -
 10
10 -
 11
11 -
 12
12 -
 13
13 -
 14
14 -
 15
15 -
 16
16 -
 17
17 -
 18
18 -
 19
19 -
 20
20 -
 21
21 -
22
-
23
-
24
-
25
-
26
-
27
-
28
-
29
-
30
-
31
-
32
-
33
-
34
-
35
-
36
-
37
-
38
-
39
-
40
-
41
-
42
-
43
-
44
-
45
-
46
-
47
-
48
-
49
-
50
-
51
-
52
-
53
-
54
-
55
-
56
-
57
-
58
-
59
-
60
-
61
-
62
-
63
-
64
-
65
-
66
-
67
-
68
-
69
-
70
-
71
-
72
-
73
-
74
-
75
-
76
-
77
-
78
-
79
-
80
-
81
-
82
-
83
-
84
-
85
-
86
-
87
-
88
-
89
-
90
-
91
-
92
-
93
-
94
-
95
-
96
-
97
-
98
-
99
-
100
-
101
-
102
-
103
-
104
-
105
-
106
-
107
-
108
-
109
-
110
-
111
-
112
-
113
-
114
-
115
-
116
-
117
-
118
-
119
-
120
-
121
-
122
-
123
-
124
-
125
-
126
-
127
-
128
-
129
-
130
-
131
-
132
-
133
-
134
-
135
-
136
-
137
-
138
-
139
-
140
-
141
-
142
 |
 |

{ 08 } { TCF Financial Corporation and Subsidiaries }
Credit Quality
Credit quality was again the most significant head-
wind for TCF in 2012. Recovery from the financial
crisis has taken longer than expected, but progress is
being made. Despite a persistent, sluggish economy,
we saw improvements in several leading indicators
throughout the year, including consumer delinquen-
cies and commercial classified assets. In 2012, we
were able to work through many of our challenges
and believe we have positioned ourselves for a
better 2013.
Credit quality in 2012 was impacted by the imple-
mentation of clarifying regulatory guidance requiring
consumer loans discharged in a Chapter 7 bankruptcy
to be reported as non-accrual loans and written
down to the estimated collateral value, less cost to
sell, regardless of delinquency status. The guidance
has resulted in an additional $49.3 million of consumer
net charge-offs and $117.7 million of consumer loans
being classified as non-accrual. While this regulatory
accounting guidance had a significant impact on
TCF’s credit metrics, it had no impact on the underly-
ing credit risk profile of the portfolio. In fact, 87.5
percent of the non-accrual assets associated with
the regulatory accounting guidance were less than
60 days past due as of December 31, 2012.
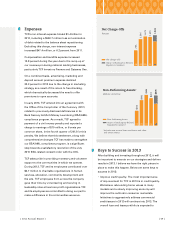
Provision for loan and lease losses in 2012 increased
$46.6 million, or 23.2 percent, from 2011 primarily
due to regulatory Chapter 7 bankruptcy guidance
and the aggressive management of commercial
credit issues. Net charge-offs of 1.54 percent were
also impacted by the regulatory guidance and
increased 9 basis points. Excluding the regulatory
guidance, net charge-offs decreased 12 percent
from 2011.
Non-performing assets, which includes non-accrual
loans and leases and other real estate owned,
increased 10 percent in 2012 including the impact
of the regulatory Chapter 7 bankruptcy guidance
which resulted in additional loans being classified
as non-accrual. Excluding this impact, non-
performing assets showed a moderate decline of
$74.4 million during the year. Other real estate
owned totaled $97 million at year-end, a decrease
of $37.9 million from 2011. At December 31, 2012,
TCF owned 639 consumer real estate properties and
21 commercial properties, compared with 723 and
35 properties, respectively, at December 31, 2011.
The leading indicator of consumer real estate credit
quality, over 60-day delinquencies, showed steady
improvement throughout the year. At year-end,
1.38 percent of consumer real estate loans were over
60-days delinquent, down 25 basis points from 2011.
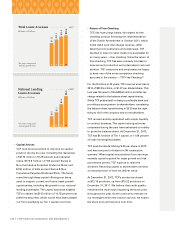
Performing classified assets, the leading indicator for
commercial, also saw significant improvement in
2012, decreasing $106 million to $224 million at
December 31, 2012. Meanwhile, the national lending
businesses continue to perform with very strong credit
metrics including low delinquencies and charge-offs.
While there is still work to be done, we are
encouraged by the trends we have seen during
2012. Home values, which are a significant factor in
consumer credit quality because they impact both
the willingness of the customer to make payments
and the charge we recognize should they default,
started to recover in many markets and we were
able to work through many of the problems in the
commercial portfolio in 2012.
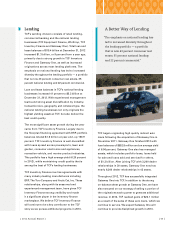
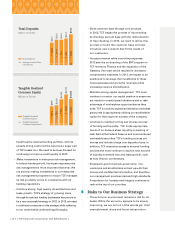
A Better Way of
Revenue Generation
“TCF, as a result of its large deposit account
base, has long been regarded as having a
strong fee-based revenue stream. With the
implementation of Regulation E in 2010 and the
Durbin Amendment in 2011, TCF has moved
toward becoming more of a spread-based
business through its balance sheet reposition-
ing and emphasis on national lending.”