TCF Bank 2012 Annual Report Download - page 48
Download and view the complete annual report
Please find page 48 of the 2012 TCF Bank annual report below. You can navigate through the pages in the report by either clicking on the pages listed below, or by using the keyword search tool below to find specific information within the annual report.-
 1
1 -
2
-
3
-
4
-
5
-
6
-
7
-
8
-
9
-
10
-
11
-
12
-
13
-
14
-
15
-
16
-
17
-
18
-
19
-
20
-
21
-
22
-
23
-
24
-
25
-
26
-
27
-
28
-
29
-
30
-
31
-
32
-
33
-
34
-
35
-
36
-
37
-
 38
38 -
 39
39 -
 40
40 -
 41
41 -
 42
42 -
 43
43 -
 44
44 -
 45
45 -
 46
46 -
 47
47 -
 48
48 -
 49
49 -
 50
50 -
 51
51 -
 52
52 -
 53
53 -
 54
54 -
 55
55 -
 56
56 -
 57
57 -
 58
58 -
59
-
60
-
61
-
62
-
63
-
64
-
65
-
66
-
67
-
68
-
69
-
70
-
71
-
72
-
73
-
74
-
75
-
76
-
77
-
78
-
79
-
80
-
81
-
82
-
83
-
84
-
85
-
86
-
87
-
88
-
89
-
90
-
91
-
92
-
93
-
94
-
95
-
96
-
97
-
98
-
99
-
100
-
101
-
102
-
103
-
104
-
105
-
106
-
107
-
108
-
109
-
110
-
111
-
112
-
113
-
114
-
115
-
116
-
117
-
118
-
119
-
120
-
121
-
122
-
123
-
124
-
125
-
126
-
127
-
128
-
129
-
130
-
131
-
132
-
133
-
134
-
135
-
136
-
137
-
138
-
139
-
140
-
141
-
142
 |
 |

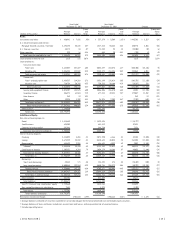
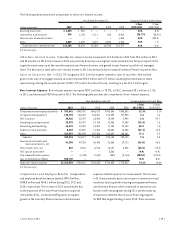
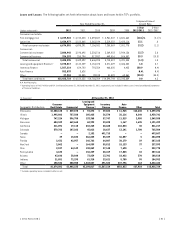
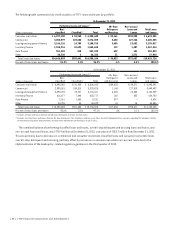
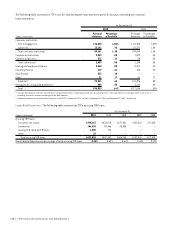
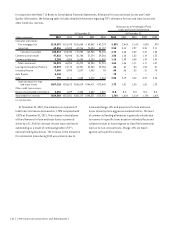
Loans and leases outstanding at December 31, 2012, are shown by contractual maturity in the following table.
At December 31, 2012(1)
(In thousands)
Consumer
Real Estate Commercial
Leasing and
Equipment
Finance(2)
Inventory
Finance
Auto
Finance Other Total
Amounts due:
Within 1 year $ 249,047 $ 663,445 $1,177,012 $1,567,214 $ 95,869 $ 3,054 $ 3,755,641
1 to 2 years 198,358 552,831 812,079 – 100,956 2,139 1,666,363
2 to 3 years 185,946 485,210 568,949 – 104,760 1,697 1,346,562
3 to 5 years 415,659 1,102,974 548,046 – 198,600 2,517 2,267,796
5 to 10 years 1,124,317 578,819 91,931 – 52,648 4,666 1,852,381
10 to 15 years 1,188,477 19,728 – – – 3,723 1,211,928
Over 15 years 3,312,697 2,228 – – – 10,128 3,325,053
Total after 1 year 6,425,454 2,741,790 2,021,005 – 456,964 24,870 11,670,083
Total $6,674,501 $3,405,235 $3,198,017 $1,567,214 $552,833 $27,924 $15,425,724
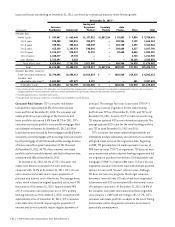
Amounts due after 1 year on:
Fixed-rate loans and leases $3,744,405 $2,044,211 $2,012,814 $ – $456,964 $24,219 $ 8,282,613
Variable- and
adjustable-rate loans(3) 2,681,049 697,579 8,191 – – 651 3,387,470
Total after 1 year $6,425,454 $2,741,790 $2,021,005 $ – $456,964 $24,870 $11,670,083
(1) Gross of deferred fees and costs. This table does not include the effect of prepayments, which is an important consideration in management’s interest-rate risk analysis.
Company experience indicates that loans and leases remain outstanding for significantly shorter periods than their contractual terms.
(2) Excludes operating leases included in other assets.
(3) Excludes fixed-term amounts under lines of credit which are included in closed-end loans.
Consumer Real Estate TCF’s consumer real estate
loan portfolio represented 43.3% of its total loan and
lease portfolio at December 31, 2012. The consumer real
estate portfolio as a percentage of the total loan and
lease portfolio decreased 5.4% from 48.7% in 2011. TCF’s
consumer real estate portfolio is secured by mortgages filed
on residential real estate. At December 31, 2012, 63.5% of
loan balances were secured by first mortgages and 36.5% were
secured by second mortgages with an average loan size secured
by a first mortgage of $113 thousand and the average balance
of loans secured by a junior lien position of $41 thousand.
At December 31, 2012, 40.7% of the consumer real estate
portfolio carried a variable interest rate tied to the prime rate,
compared with 35% at December 31, 2011.
At December 31, 2012, 68.1% of TCF’s consumer real
estate loan balance consisted of closed-end loans,
compared with 74.2% at December 31, 2011. TCF’s closed-
end consumer real estate loans require payments of
principal and interest over a fixed term. The average home
value, which is based on original appraisal value, was $291
thousand as of December 31, 2012. Approximately 94%
of TCF’s consumer real estate loans are in TCF’s primary
banking markets as of December 31, 2012, compared with
substantially all as of December 31, 2011. TCF’s consumer
real estate lines of credit require regular payments of
interest and do not currently require regular payments of
principal. The average Fair Isaac Corporation (“FICO®”)
credit score at loan origination for the retail lending
portfolio was 729 as of December 31, 2012, and 727 as of
December 31, 2011. As part of TCF’s credit risk monitoring,
TCF obtains updated FICO score information quarterly. The
average updated FICO score for the retail lending portfolio
was 727 at both December 31, 2012 and 2011.
TCF’s consumer real estate underwriting standards are
intended to produce adequately secured loans to customers
with good credit scores at the origination date. Beginning
in 2008, TCF generally has not made new loans in excess of
90% loan-to-value (“LTV”) at origination. TCF does not have
any consumer real estate subprime lending programs and did
not originate or purchase from brokers 2/28 adjustable-rate
mortgages (“ARM”) or Option ARM loans. TCF also has not
originated consumer real estate loans with multiple payment
options or loans with “teaser” interest rates. Although
TCF does not have any programs that target subprime
borrowers, loans at lower LTV ratios have been originated
to borrowers with FICO scores below 620 in the normal course
of lending to customers. At December 31, 2012, 36.9% of
the consumer real estate loan balance had been originated
since January 1, 2009 with net charge-offs of .2%. TCF’s
consumer real estate portfolio is subject to the risk of falling
home values and to the general economic environment,
particularly unemployment.
{ 32 } { TCF Financial Corporation and Subsidiaries }