TCF Bank 2012 Annual Report Download - page 58
Download and view the complete annual report
Please find page 58 of the 2012 TCF Bank annual report below. You can navigate through the pages in the report by either clicking on the pages listed below, or by using the keyword search tool below to find specific information within the annual report.-
 1
1 -
2
-
3
-
4
-
5
-
6
-
7
-
8
-
9
-
10
-
11
-
12
-
13
-
14
-
15
-
16
-
17
-
18
-
19
-
20
-
21
-
22
-
23
-
24
-
25
-
26
-
27
-
28
-
29
-
30
-
31
-
32
-
33
-
34
-
35
-
36
-
37
-
38
-
39
-
40
-
41
-
42
-
43
-
44
-
45
-
46
-
47
-
 48
48 -
 49
49 -
 50
50 -
 51
51 -
 52
52 -
 53
53 -
 54
54 -
 55
55 -
 56
56 -
 57
57 -
 58
58 -
 59
59 -
 60
60 -
 61
61 -
 62
62 -
 63
63 -
 64
64 -
 65
65 -
 66
66 -
 67
67 -
 68
68 -
69
-
70
-
71
-
72
-
73
-
74
-
75
-
76
-
77
-
78
-
79
-
80
-
81
-
82
-
83
-
84
-
85
-
86
-
87
-
88
-
89
-
90
-
91
-
92
-
93
-
94
-
95
-
96
-
97
-
98
-
99
-
100
-
101
-
102
-
103
-
104
-
105
-
106
-
107
-
108
-
109
-
110
-
111
-
112
-
113
-
114
-
115
-
116
-
117
-
118
-
119
-
120
-
121
-
122
-
123
-
124
-
125
-
126
-
127
-
128
-
129
-
130
-
131
-
132
-
133
-
134
-
135
-
136
-
137
-
138
-
139
-
140
-
141
-
142
 |
 |
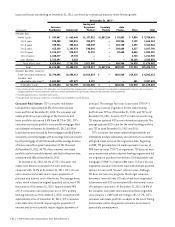
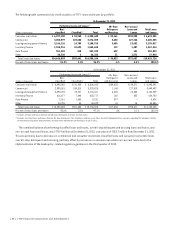
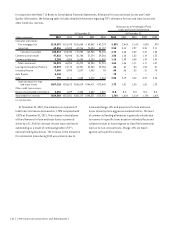
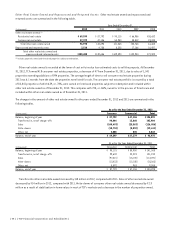
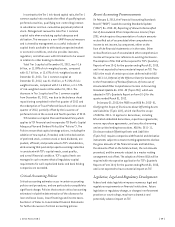
In conjunction with Note 7 of Notes to Consolidated Financial Statements, Allowance for Loan and Lease Losses and Credit
Quality Information, the following table includes detailed information regarding TCF’s allowance for loan and lease losses and
other credit loss reserves.
Allowance as a Percentage of Total
Loans and Leases Outstanding
At December 31, At December 31,
(Dollars in thousands) 2012 2011 2010 2009 2008 2012 2011 2010 2009 2008
Consumer real estate:
First mortgage lien $119,957 $115,740 $105,634 $ 89,542 $ 47,279 2.83% 2.44% 2.16% 1.80% .97%
Junior lien 62,056 67,695 67,216 75,424 51,157 2.55 3.14 2.97 3.25 2.11
Consumer real estate 182,013 183,435 172,850 164,966 98,436 2.73 2.66 2.42 2.27 1.35
Commercial real estate 47,821 40,446 50,788 37,274 39,386 1.55 1.26 1.53 1.14 1.32
Commercial business 3,754 6,508 11,690 6,230 11,865 1.16 2.59 3.68 1.39 2.34
Total commercial 51,575 46,954 62,478 43,504 51,251 1.51 1.36 1.71 1.17 1.47
Leasing and equipment finance 21,037 21,173 26,301 32,063 20,058 .66 .67 .83 1.04 .81
Inventory finance 7,569 2,996 2,537 1,462 33 .48 .48 .32 .31 .75
Auto finance 4,136 – – – – .75 – – – –
Other 798 1,114 1,653 2,476 2,664 2.86 3.19 4.22 4.82 4.26
Total allowance for loan
and lease losses $267,128 $255,672 $265,819 $244,471 $172,442 1.73 1.81 1.80 1.68 1.29
Other credit loss reserves:
Reserves for unfunded commitments 2,456 1,829 2,353 3,850 1,510 N.A. N.A. N.A. N.A. N.A.
Total credit loss reserves $269,584 $257,501 $268,172 $248,321 $173,952 1.75% 1.82% 1.81% 1.70% 1.30%
N.A. Not Applicable.
At December 31, 2012, the allowance as a percent of
total loans and leases decreased to 1.73% compared with
1.81% at December 31, 2011. The increase in the balance
of the allowance for loan and lease losses is primarily
driven by a $1.3 billion increase in total loans and leases
outstanding as a result of continued growth in TCF’s
national lending businesses. The increase in the allowance
for commercial loans during 2012 was primarily due to
increased charge-offs and provisions for loan and lease
losses driven by more aggressive workout tactics. The level
of commercial lending allowances is generally volatile due
to reserves for specific loans based on individual facts and
collateral values as loans migrate to classified commercial
loans or to non-accrual loans. Charge-offs are taken
against such specific reserves.
{ 42 } { TCF Financial Corporation and Subsidiaries }