TCF Bank 2012 Annual Report Download - page 51
Download and view the complete annual report
Please find page 51 of the 2012 TCF Bank annual report below. You can navigate through the pages in the report by either clicking on the pages listed below, or by using the keyword search tool below to find specific information within the annual report.-
 1
1 -
2
-
3
-
4
-
5
-
6
-
7
-
8
-
9
-
10
-
11
-
12
-
13
-
14
-
15
-
16
-
17
-
18
-
19
-
20
-
21
-
22
-
23
-
24
-
25
-
26
-
27
-
28
-
29
-
30
-
31
-
32
-
33
-
34
-
35
-
36
-
37
-
38
-
39
-
40
-
 41
41 -
 42
42 -
 43
43 -
 44
44 -
 45
45 -
 46
46 -
 47
47 -
 48
48 -
 49
49 -
 50
50 -
 51
51 -
 52
52 -
 53
53 -
 54
54 -
 55
55 -
 56
56 -
 57
57 -
 58
58 -
 59
59 -
 60
60 -
 61
61 -
62
-
63
-
64
-
65
-
66
-
67
-
68
-
69
-
70
-
71
-
72
-
73
-
74
-
75
-
76
-
77
-
78
-
79
-
80
-
81
-
82
-
83
-
84
-
85
-
86
-
87
-
88
-
89
-
90
-
91
-
92
-
93
-
94
-
95
-
96
-
97
-
98
-
99
-
100
-
101
-
102
-
103
-
104
-
105
-
106
-
107
-
108
-
109
-
110
-
111
-
112
-
113
-
114
-
115
-
116
-
117
-
118
-
119
-
120
-
121
-
122
-
123
-
124
-
125
-
126
-
127
-
128
-
129
-
130
-
131
-
132
-
133
-
134
-
135
-
136
-
137
-
138
-
139
-
140
-
141
-
142
 |
 |

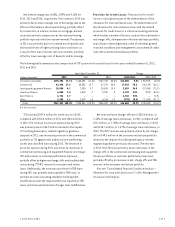
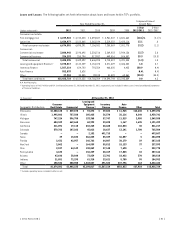
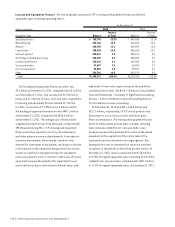
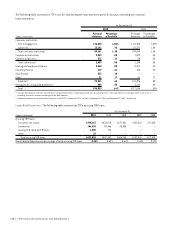
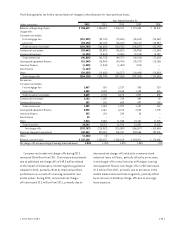
TCF Inventory Finance The following table summarizes TCF’s inventory finance portfolio by marketing segment.
At December 31,
(Dollars in thousands) 2012 2011
Marketing Segment Balance
Percent
of Total Balance
Percent
of Total
Powersports $ 943,704 60.2% $153,217 24.5%
Lawn and garden 339,224 21.7 324,607 52.0
Electronics and appliances 50,394 3.2 52,603 8.4
Other 233,892 14.9 94,273 15.1
Total $1,567,214 100.0% $624,700 100.0%
Inventory finance continued to expand its core programs
during 2012, primarily in the powersports industry, with an
increase in the total portfolio to $1.6 billion, or 10.2% of
total loans and leases, at December 31, 2012, compared with
$624.7 million, or 4.4% at December 31, 2011. The increase
was primarily due to the funding of BRP dealers beginning
February 1, 2012. Inventory finance originations increased to
$5.2 billion in 2012 compared to $2.5 billion in 2011.
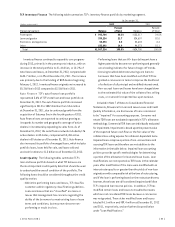
Auto Finance TCF’s auto finance loan portfolio
represented 3.6% of TCF’s total loan and lease portfolio at
December 31, 2012. The auto finance portfolio increased
significantly in 2012 to $552.8 million from $3.6 million
at December 31, 2011, due to continued growth from the
acquisition of Gateway One in the fourth quarter of 2011.
Auto finance loans are expected to continue growing as
it expands its number and geographic coverage of active
dealers in its network by expanding its sales force. As of
December 31, 2012, the auto finance network included 6,176
active dealers in 43 states, compared with 3,451 active
dealers in 30 states as of December 31, 2011. Auto finance
also increased its portfolio of managed loans, which includes
portfolio loans, loans held for sale, and loans sold and
serviced for others to $1.3 billion as of December 31, 2012.
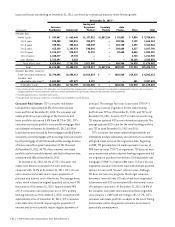
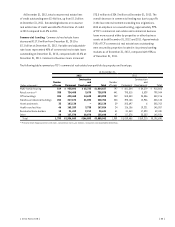
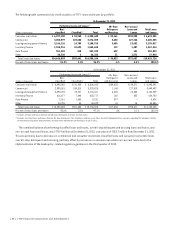
Credit Quality The following tables summarize TCF’s
loan and lease portfolio based on what TCF believes are
the most important credit quality data that should be used
to understand the overall condition of the portfolio. The
following items should be considered throughout the credit
quality section.
• Within the performing loans and leases, TCF classifies
customers within regulatory classification guidelines.
Loans and leases that are “classified” are loans or
leases that management has concerns regarding the
ability of the borrowers to meet existing loan or lease
terms and conditions, but may never become non-
performing or result in a loss.
• Performing loans that are 60+ days delinquent have a
higher potential to become non-performing and generally
are a leading indicator for future charge-off trends.
• Accruing troubled debt restructurings are loans to
borrowers that have been modified such that TCF has
granted a concession in terms to improve the likelihood
of collection of all principal and modified interest owed.
• Non-accrual loans and leases have been charged down
to the estimated fair value of the collateral less selling
costs, or reserved for expected loss upon workout.
Included in Note 7 of Notes to Consolidated Financial
Statements, Allowance for Loan and Lease Losses and Credit
Quality Information, are disclosures of loans considered
to be “impaired” for accounting purposes. Consumer real
estate TDR loans are evaluated separately in TCF’s allowance
methodology. Commercial TDR loans are individually evaluated
for impairment. Impairment is based upon the present value
of the expected future cash flows or the fair value of the
collateral less selling expense for collateral-dependent loans.
Impaired loans comprise a portion of non-accrual loans and
accruing TDR loans and therefore are not additive to the
information in the table below. Impaired loan accounting
policies prescribe specific methodologies for determining
a portion of the allowance for loan and lease losses. Loan
modifications are not reported as TDR loans in the calendar
years after modification if the loans were modified with an
interest rate equal to or greater than the yields of new loan
originations with comparable risk at the time of restructuring,
and if the loan is performing based on the restructured terms;
however, these loans are still considered impaired and follow
TCF’s impaired loan reserve policies. In addition, TCF has
modified certain loans and leases to troubled borrowers
which are not considered TDR loans because a concession
was not granted. These other modified loans and leases
totaled $6.1 million and $39.4 million at December 31, 2012
and 2011, respectively, and are further discussed below
under “Loan Modifications.”
{ 2012 Form 10K } { 35 }