TCF Bank 2012 Annual Report Download - page 35
Download and view the complete annual report
Please find page 35 of the 2012 TCF Bank annual report below. You can navigate through the pages in the report by either clicking on the pages listed below, or by using the keyword search tool below to find specific information within the annual report.-
 1
1 -
2
-
3
-
4
-
5
-
6
-
7
-
8
-
9
-
10
-
11
-
12
-
13
-
14
-
15
-
16
-
17
-
18
-
19
-
20
-
21
-
22
-
23
-
24
-
 25
25 -
 26
26 -
 27
27 -
 28
28 -
 29
29 -
 30
30 -
 31
31 -
 32
32 -
 33
33 -
 34
34 -
 35
35 -
 36
36 -
 37
37 -
 38
38 -
 39
39 -
 40
40 -
 41
41 -
 42
42 -
 43
43 -
 44
44 -
 45
45 -
46
-
47
-
48
-
49
-
50
-
51
-
52
-
53
-
54
-
55
-
56
-
57
-
58
-
59
-
60
-
61
-
62
-
63
-
64
-
65
-
66
-
67
-
68
-
69
-
70
-
71
-
72
-
73
-
74
-
75
-
76
-
77
-
78
-
79
-
80
-
81
-
82
-
83
-
84
-
85
-
86
-
87
-
88
-
89
-
90
-
91
-
92
-
93
-
94
-
95
-
96
-
97
-
98
-
99
-
100
-
101
-
102
-
103
-
104
-
105
-
106
-
107
-
108
-
109
-
110
-
111
-
112
-
113
-
114
-
115
-
116
-
117
-
118
-
119
-
120
-
121
-
122
-
123
-
124
-
125
-
126
-
127
-
128
-
129
-
130
-
131
-
132
-
133
-
134
-
135
-
136
-
137
-
138
-
139
-
140
-
141
-
142
 |
 |

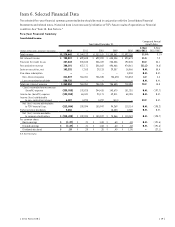
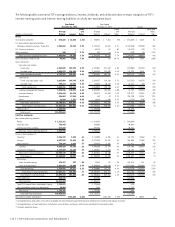
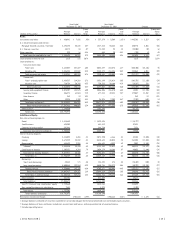
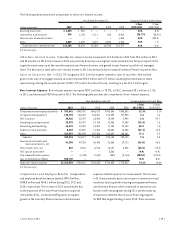
Item 6. Selected Financial Data
The selected five-year financial summary presented below should be read in conjunction with the Consolidated Financial
Statements and related notes. Historical data is not necessarily indicative of TCF’s future results of operations or financial
condition. See “Item 1A. Risk Factors.”
Five-Year Financial Summary
Consolidated Income:
Year Ended December 31,
Compound Annual
Growth Rate
(Dollars in thousands, except per-share data) 2012 2011 2010 2009 2008
1-Year
2012/2011
5-Year
2012/2007
Total revenue $1,270,442 $1,144,122 $1,237,187 $1,158,861 $1,092,108 11.0% 3.1%
Net interest income $ 780,019 $ 699,688 $ 699,202 $ 633,006 $ 593,673 11.5 7.2
Provision for credit losses 247,443 200,843 236,437 258,536 192,045 23.2 34.1
Fees and other revenue 388,191 437,171 508,862 496,468 474,061 (11.2) (4.6)
Gains on securities, net 102,232 7,263 29,123 29,387 16,066 N.M. 50.4
Visa share redemption – – – – 8,308 N.M. N.M.
Non-interest expense 811,819 764,451 756,335 756,655 718,853 6.2 4.4
Loss on termination of debt 550,735 – – – – N.M. N.M.
Total non-interest expense 1,362,554 764,451 756,335 756,655 718,853 78.2 15.8
(Loss) income before income tax
(benefit) expense (339,555) 178,828 244,415 143,670 181,210 N.M. (197.7)
Income tax (benefit) expense (132,858) 64,441 90,171 49,811 68,096 N.M. N.M.
Income (loss) attributable
to non-controlling interest 6,187 4,993 3,297 (410) – 23.9 N.M.
Net (loss) income attributable
to TCF Financial Corp. (212,884) 109,394 150,947 94,269 113,114 N.M. (195.2)
Preferred stock dividends 5,606 – – 18,403 2,540 N.M. N.M.
Net (loss) income available
to common stockholders $ (218,490) $ 109,394 $ 150,947 $ 75,866 $ 110,574 N.M. (195.7)
Per common share:
Basic earnings $ (1.37) $ .71 $ 1.08 $ .60 $ .88 N.M. (191.6)
Diluted earnings $ (1.37) $ .71 $ 1.08 $ .60 $ .88 N.M. (191.6)
Dividends declared $ .20 $ .20 $ .20 $ .40 $ 1.00 – (27.1)
N.M. Not Meaningful.
{ 2012 Form 10K } { 19 }