TCF Bank 2012 Annual Report Download - page 69
Download and view the complete annual report
Please find page 69 of the 2012 TCF Bank annual report below. You can navigate through the pages in the report by either clicking on the pages listed below, or by using the keyword search tool below to find specific information within the annual report.-
 1
1 -
2
-
3
-
4
-
5
-
6
-
7
-
8
-
9
-
10
-
11
-
12
-
13
-
14
-
15
-
16
-
17
-
18
-
19
-
20
-
21
-
22
-
23
-
24
-
25
-
26
-
27
-
28
-
29
-
30
-
31
-
32
-
33
-
34
-
35
-
36
-
37
-
38
-
39
-
40
-
41
-
42
-
43
-
44
-
45
-
46
-
47
-
48
-
49
-
50
-
51
-
52
-
53
-
54
-
55
-
56
-
57
-
58
-
 59
59 -
 60
60 -
 61
61 -
 62
62 -
 63
63 -
 64
64 -
 65
65 -
 66
66 -
 67
67 -
 68
68 -
 69
69 -
 70
70 -
 71
71 -
 72
72 -
 73
73 -
 74
74 -
 75
75 -
 76
76 -
 77
77 -
 78
78 -
 79
79 -
80
-
81
-
82
-
83
-
84
-
85
-
86
-
87
-
88
-
89
-
90
-
91
-
92
-
93
-
94
-
95
-
96
-
97
-
98
-
99
-
100
-
101
-
102
-
103
-
104
-
105
-
106
-
107
-
108
-
109
-
110
-
111
-
112
-
113
-
114
-
115
-
116
-
117
-
118
-
119
-
120
-
121
-
122
-
123
-
124
-
125
-
126
-
127
-
128
-
129
-
130
-
131
-
132
-
133
-
134
-
135
-
136
-
137
-
138
-
139
-
140
-
141
-
142
 |
 |
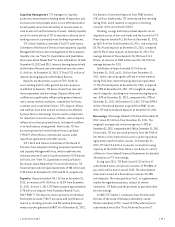
rate indices (basis risk). Management measures these risks
and their impact in various ways, including through the
use of simulation and valuation analyses. The interest rate
scenarios may include gradual or rapid changes in interest
rates, spread narrowing and widening, yield curve twists
and changes in assumptions about customer behavior in
various interest rate scenarios.
TCF utilizes net interest income simulation models to
estimate the near-term effects (next one to two years)
of changing interest rates on its net interest income.
Net interest income simulation involves forecasting net
interest income under a variety of scenarios, including
through variation of interest rate levels, the shape of
the yield curve and the spreads between market interest
rates. Management exercises its best judgment in making
assumptions regarding both events that management can
influence, such as non-contractual deposit repricings, and
events outside of its control, such as customer behavior on
loan and deposit activity and the effect that competition
has on both loan and deposit pricing. These assumptions
are inherently uncertain and, as a result, net interest
income simulation results will likely differ from actual
results due to the timing, magnitude and frequency of
interest rate changes, changes in market conditions,
customer behavior and management strategies, among
other factors.
At December 31, 2012, net interest income is estimated to
increase by 3.1%, compared with the base case scenario over
the next 12 months if short- and long-term interest rates
were to sustain an immediate increase of 100 basis points.
Management also uses valuation analyses to measure
risk in the balance sheet that might not be taken into
account in the net interest income simulation analyses.
Net interest income simulation highlights exposure over
a relatively short time period (12 or 24 months), while
valuation analysis incorporates all cash flows over the
estimated remaining life of all balance sheet positions.
The valuation of the balance sheet, at a point in time,
is defined as the discounted present value of asset cash
flows minus the discounted value of liability cash flows.
Valuation analysis addresses only the current balance
sheet and does not incorporate the growth assumptions
that are used in the net interest income simulation model.
As with the net interest income simulation model, valuation
analysis is based on key assumptions about the timing and
variability of balance sheet cash flows and does not take
into account any potential responses by management to
anticipated changes in interest rates.
Management also utilizes an interest rate gap
measurement, which is calculated by taking the difference
between interest-earning assets and interest-bearing
liabilities repricing within a given period. While the interest
rate gap measurement has some limitations, including
a lack of assumptions regarding future asset or liability
production and a static interest rate assumption, it
represents the net asset or liability sensitivity at a point
in time. An interest rate gap measurement could be
significantly affected by external factors such as loan
prepayments, early withdrawals of deposits, changes in
the correlation of various interest-bearing instruments,
competition or a rise or decline in interest rates.
TCF’s one-year interest rate gap was a positive $903.9
million, or 5% of total assets, at December 31, 2012,
compared with a positive $2.1 billion, or 10.9% of total
assets, at December 31, 2011. The change in the gap from
the previous year-end is primarily due to the balance sheet
repositioning completed in the first quarter of 2012 and
growth of fixed-rate auto loans, partially offset by growth
in certificates of deposit with maturities greater than one
year. A positive interest rate gap position exists when the
amount of interest-earning assets maturing or repricing
exceeds the amount of interest-bearing liabilities
maturing or repricing, including assumed prepayments,
within a particular time period. A negative interest rate
gap position exists when the amount of interest-bearing
liabilities maturing or repricing exceeds the amount of
interest-earning assets maturing or repricing, including
assumed prepayments, within a particular time period.
TCF estimates that an immediate 25 basis point
decrease in current mortgage loan interest rates would
increase prepayments on the $4.6 billion of fixed-rate
mortgage-backed securities and consumer real estate
loans at December 31, 2012, by approximately $48 million,
or 10%, in the first year. An increase in prepayments
would decrease the estimated life of the portfolios
and may adversely impact net interest income or net
interest margin in the future. Although prepayments
on fixed-rate portfolios are currently at a relatively
low level, TCF estimates that an immediate 100 basis
point increase in current mortgage loan interest rates
would reduce prepayments on the fixed-rate mortgage-
backed securities, residential real estate loans and
consumer loans at December 31, 2012, by approximately
{ 2012 Form 10K } { 53 }