TCF Bank 2012 Annual Report Download - page 9
Download and view the complete annual report
Please find page 9 of the 2012 TCF Bank annual report below. You can navigate through the pages in the report by either clicking on the pages listed below, or by using the keyword search tool below to find specific information within the annual report.-
 1
1 -
 2
2 -
 3
3 -
 4
4 -
 5
5 -
 6
6 -
 7
7 -
 8
8 -
 9
9 -
 10
10 -
 11
11 -
 12
12 -
 13
13 -
 14
14 -
 15
15 -
 16
16 -
 17
17 -
 18
18 -
 19
19 -
 20
20 -
21
-
22
-
23
-
24
-
25
-
26
-
27
-
28
-
29
-
30
-
31
-
32
-
33
-
34
-
35
-
36
-
37
-
38
-
39
-
40
-
41
-
42
-
43
-
44
-
45
-
46
-
47
-
48
-
49
-
50
-
51
-
52
-
53
-
54
-
55
-
56
-
57
-
58
-
59
-
60
-
61
-
62
-
63
-
64
-
65
-
66
-
67
-
68
-
69
-
70
-
71
-
72
-
73
-
74
-
75
-
76
-
77
-
78
-
79
-
80
-
81
-
82
-
83
-
84
-
85
-
86
-
87
-
88
-
89
-
90
-
91
-
92
-
93
-
94
-
95
-
96
-
97
-
98
-
99
-
100
-
101
-
102
-
103
-
104
-
105
-
106
-
107
-
108
-
109
-
110
-
111
-
112
-
113
-
114
-
115
-
116
-
117
-
118
-
119
-
120
-
121
-
122
-
123
-
124
-
125
-
126
-
127
-
128
-
129
-
130
-
131
-
132
-
133
-
134
-
135
-
136
-
137
-
138
-
139
-
140
-
141
-
142
 |
 |

at the Federal Reserve. TCF has also issued preferred
stock and subordinated debt in 2012 to help fund future
asset growth and is actively identifying alternative
funding sources that may be beneficial in the future,
such as developing securitization capabilities.
To execute on our asset growth strategy moving
forward, TCF needs to have diversified funding
sources and flexibility in place to take advantage of
marketplace opportunities. With the actions taken in
2012 and the management structure in place, we are
well-positioned to meet our goals in 2013.
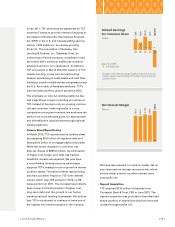
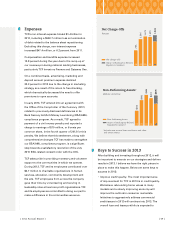
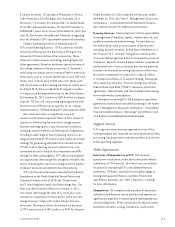
Revenue
In 2012, TCF worked to further diversify its revenue
sources. TCF, as a result of its large deposit account
base, has long been regarded as having a strong
fee-based revenue stream. With the implementation
of Regulation E in 2010 and the Durbin Amendment
in 2011, TCF has moved toward becoming more of a
spread-based business through its balance sheet
repositioning and emphasis on national lending.
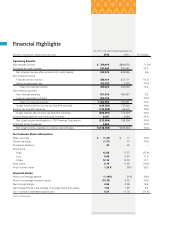
TCF’s total revenue was $1.3 billion in 2012, up
11 percent from 2011. Net interest income increased
11.5 percent while non-interest income increased
10.3 percent. The reduction in long-term debt and
the growth in the higher yielding national lending
businesses have allowed TCF to create additional
net interest income.
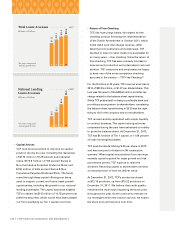
Banking fees and service charges decreased
18.9 percent in 2012 due to the impact of regulatory
changes and a reduced checking account base
resulting from the impact of product changes made
in 2011. Now that free checking is back at TCF, we
have recently seen increases in gross account
production, decreases in attrition and reduced
premium expense to open accounts. It will take some
time to restore our checking account base and make
up the lost maintenance fee revenue, but with the
return of free checking, we are optimistic we can
meet this goal in 2013.
While leasing and equipment finance revenue of
$92.7 million, up 4 percent in 2012, continues to be a
key revenue source for TCF, we introduced additional
core revenue sources during the year with the gains
from the sales of auto loans and consumer real
estate loans. We expect these loan sales to remain
core sources of revenue in 2013.
Card revenue in 2012 totaled $52.6 million, a 45.3
percent decline from 2011 due to the full year impact
of the Durbin Amendment, which went into effect in
October 2011. Increased net interest income resulting
from the balance sheet repositioning as well as new
core revenue sources, including the gains from the
sales of loans, have and are expected to continue to
play a significant role in replacing this lost revenue.
Fees & Service
Charges
Millions of Dollars
1211100908
$178
$271
$287
$273
$219
Total Revenue
Millions of Dollars
1211100908
$1,27
0
$1,092
$1,159
$1,237
$1,144
Net Interest Income
Non-Interest Income
{ 2012 Annual Report } { 07 }