TCF Bank 2012 Annual Report Download - page 2
Download and view the complete annual report
Please find page 2 of the 2012 TCF Bank annual report below. You can navigate through the pages in the report by either clicking on the pages listed below, or by using the keyword search tool below to find specific information within the annual report.-
 1
1 -
 2
2 -
 3
3 -
 4
4 -
 5
5 -
 6
6 -
 7
7 -
 8
8 -
 9
9 -
 10
10 -
 11
11 -
 12
12 -
 13
13 -
14
-
15
-
16
-
17
-
18
-
19
-
20
-
21
-
22
-
23
-
24
-
25
-
26
-
27
-
28
-
29
-
30
-
31
-
32
-
33
-
34
-
35
-
36
-
37
-
38
-
39
-
40
-
41
-
42
-
43
-
44
-
45
-
46
-
47
-
48
-
49
-
50
-
51
-
52
-
53
-
54
-
55
-
56
-
57
-
58
-
59
-
60
-
61
-
62
-
63
-
64
-
65
-
66
-
67
-
68
-
69
-
70
-
71
-
72
-
73
-
74
-
75
-
76
-
77
-
78
-
79
-
80
-
81
-
82
-
83
-
84
-
85
-
86
-
87
-
88
-
89
-
90
-
91
-
92
-
93
-
94
-
95
-
96
-
97
-
98
-
99
-
100
-
101
-
102
-
103
-
104
-
105
-
106
-
107
-
108
-
109
-
110
-
111
-
112
-
113
-
114
-
115
-
116
-
117
-
118
-
119
-
120
-
121
-
122
-
123
-
124
-
125
-
126
-
127
-
128
-
129
-
130
-
131
-
132
-
133
-
134
-
135
-
136
-
137
-
138
-
139
-
140
-
141
-
142
 |
 |
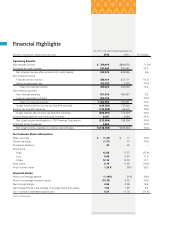
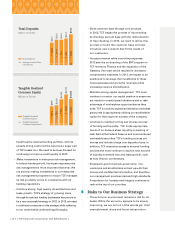
.......... Financial Highlights
At or For the Year Ended December 31,
(Dollars in thousands, except per-share data) 2012 2011 % Change
Operating Results:
Net interest income $ 780,019 $699,688 11.5%
Provision for credit losses 247,443 200,843 23.2
Net interest income after provision for credit losses 532,576 498,845 6.8
Non-interest income:
Fees and other revenue 388,191 437,171 (11.2)
Gains on securities, net 102,232 7,263 N.M.
Total non-interest income 490,423 444,434 10.3
Non-interest expense:
Non-interest expense 811,819 764,451 6.2
Loss on termination of debt 550,735 – N.M.
Total non-interest expense 1,362,554 764,451 78.2
(Loss) income before income tax (benefit) expense (339,555) 178,828 N.M.
Income tax (benefit) expense (132,858) 64,441 N.M.
(Loss) income after income tax (benefit) expense (206,697) 114,387 N.M.
Income attributable to non-controlling interests 6,187 4,993 23.9
Net (loss) income attributable to TCF Financial Corporation (212,884) 109,394 N.M.
Preferred stock dividends 5,606 – N.M.
Net (loss) income available to common stockholders $ (218,490) $109,394 N.M.
Per Common Share Information:
Basic earnings $ (1.37) $ .71 N.M.
Diluted earnings (1.37) .71 N.M.
Dividends declared .20 .20 –
Stock price:
High 12.58 17.37 (27.6)
Low 9.59 8.61 11.4
Close 12.15 10.32 17.7
Book value 9.79 11.65 (16.0)
Price to book value 1.24 X .89 X 39.3
Financial Ratios:
Return on average assets (1.14)% .61% N.M.
Return on average common equity (13.33) 6.32 N.M.
Net interest margin 4.65 3.99 16.5
Net charge-offs as a percentage of average loans and leases 1.54 1.45 6.2
Tier 1 common risk-based capital ratio 9.21 11.74 (21.6)
N.M. Not Meaningful.