TCF Bank 2012 Annual Report Download - page 50
Download and view the complete annual report
Please find page 50 of the 2012 TCF Bank annual report below. You can navigate through the pages in the report by either clicking on the pages listed below, or by using the keyword search tool below to find specific information within the annual report.-
 1
1 -
2
-
3
-
4
-
5
-
6
-
7
-
8
-
9
-
10
-
11
-
12
-
13
-
14
-
15
-
16
-
17
-
18
-
19
-
20
-
21
-
22
-
23
-
24
-
25
-
26
-
27
-
28
-
29
-
30
-
31
-
32
-
33
-
34
-
35
-
36
-
37
-
38
-
39
-
 40
40 -
 41
41 -
 42
42 -
 43
43 -
 44
44 -
 45
45 -
 46
46 -
 47
47 -
 48
48 -
 49
49 -
 50
50 -
 51
51 -
 52
52 -
 53
53 -
 54
54 -
 55
55 -
 56
56 -
 57
57 -
 58
58 -
 59
59 -
 60
60 -
61
-
62
-
63
-
64
-
65
-
66
-
67
-
68
-
69
-
70
-
71
-
72
-
73
-
74
-
75
-
76
-
77
-
78
-
79
-
80
-
81
-
82
-
83
-
84
-
85
-
86
-
87
-
88
-
89
-
90
-
91
-
92
-
93
-
94
-
95
-
96
-
97
-
98
-
99
-
100
-
101
-
102
-
103
-
104
-
105
-
106
-
107
-
108
-
109
-
110
-
111
-
112
-
113
-
114
-
115
-
116
-
117
-
118
-
119
-
120
-
121
-
122
-
123
-
124
-
125
-
126
-
127
-
128
-
129
-
130
-
131
-
132
-
133
-
134
-
135
-
136
-
137
-
138
-
139
-
140
-
141
-
142
 |
 |

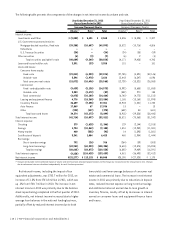
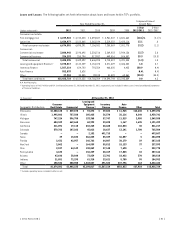
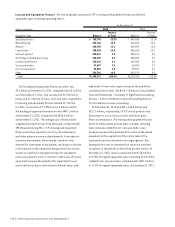
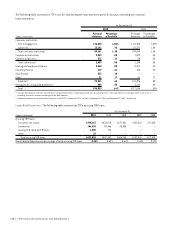
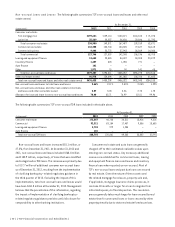
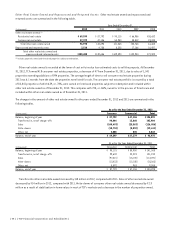
Leasing and Equipment Finance The following table summarizes TCF’s leasing and equipment finance portfolio by
equipment type, excluding operating leases.
At December 31,
(Dollars in thousands) 2012 2011
Equipment Type Balance
Percent
of Total Balance
Percent
of Total
Specialty vehicles $ 765,705 23.9% $ 693,435 22.1%
Manufacturing 439,752 13.8 476,963 15.2
Medical 418,958 13.1 424,591 13.5
Construction 334,940 10.5 336,563 10.7
Golf cart and turf 303,551 9.5 296,871 9.4
Technology and data processing 260,829 8.2 286,596 9.1
Furniture and fixtures 163,934 5.1 169,004 5.4
Trucks and trailers 97,497 3.0 68,983 2.2
Exercise equipment 83,065 2.6 95,981 3.1
Other 329,786 10.3 293,272 9.3
Total $3,198,017 100.0% $3,142,259 100.0%
The leasing and equipment finance portfolio was
$3.2 billion at December 31, 2012, compared with $3.1 billion
as of December 31, 2011, and consisted of $1.9 billion of
leases and $1.3 billion of loans. Loan and lease originations
for leasing and equipment finance totaled $1.7 billion
for 2012, an increase of 12.9% from $1.5 billion in 2011.
The backlog of approved transactions was $443.1 million
at December 31, 2012, compared with $455.3 million
at December 31, 2011. The average size of transactions
originated during 2012 was $106 thousand, compared with
$94 thousand during 2011. TCF’s leasing and equipment
finance activity is subject to risk of cyclical downturns
and other adverse economic developments. In an adverse
economic environment, there may be a decline in the
demand for some types of equipment, resulting in a decline
in the amount of new equipment being placed into service
as well as a decline in equipment values for equipment
previously placed in service. Declines in the value of leased
equipment increase the potential for impairment losses
and credit losses due to diminished collateral value, and
may result in lower sales-type revenue at the end of the
contractual lease term. See Note 1 of Notes to Consolidated
Financial Statements — Summary of Significant Accounting
Policies — Policies Related to Critical Accounting Policies
for information on lease accounting.
At December 31, 2012 and 2011, $63.9 million and
$121.7 million, respectively, of TCF’s lease portfolio was
discounted on a non-recourse basis with third-party
financial institutions. The leasing and equipment finance
portfolio tables above present lease residuals including
lease residuals related to non-recourse debt. Lease
residuals represent the estimated fair value of the leased
equipment at the expiration of the initial term of the
transaction and are reviewed on an ongoing basis. Any
downward revisions in estimated fair value are recorded
to expense in the periods in which they become known. At
December 31, 2012, lease residuals totaled $118 million,
or 9.74% of original equipment value, including $14.8 million
related to non-recourse sales, compared with $129.1 million,
or 11.2% of original equipment value, at December 31, 2011.
{ 34 } { TCF Financial Corporation and Subsidiaries }