TCF Bank 2012 Annual Report Download - page 47
Download and view the complete annual report
Please find page 47 of the 2012 TCF Bank annual report below. You can navigate through the pages in the report by either clicking on the pages listed below, or by using the keyword search tool below to find specific information within the annual report.-
 1
1 -
2
-
3
-
4
-
5
-
6
-
7
-
8
-
9
-
10
-
11
-
12
-
13
-
14
-
15
-
16
-
17
-
18
-
19
-
20
-
21
-
22
-
23
-
24
-
25
-
26
-
27
-
28
-
29
-
30
-
31
-
32
-
33
-
34
-
35
-
36
-
 37
37 -
 38
38 -
 39
39 -
 40
40 -
 41
41 -
 42
42 -
 43
43 -
 44
44 -
 45
45 -
 46
46 -
 47
47 -
 48
48 -
 49
49 -
 50
50 -
 51
51 -
 52
52 -
 53
53 -
 54
54 -
 55
55 -
 56
56 -
 57
57 -
58
-
59
-
60
-
61
-
62
-
63
-
64
-
65
-
66
-
67
-
68
-
69
-
70
-
71
-
72
-
73
-
74
-
75
-
76
-
77
-
78
-
79
-
80
-
81
-
82
-
83
-
84
-
85
-
86
-
87
-
88
-
89
-
90
-
91
-
92
-
93
-
94
-
95
-
96
-
97
-
98
-
99
-
100
-
101
-
102
-
103
-
104
-
105
-
106
-
107
-
108
-
109
-
110
-
111
-
112
-
113
-
114
-
115
-
116
-
117
-
118
-
119
-
120
-
121
-
122
-
123
-
124
-
125
-
126
-
127
-
128
-
129
-
130
-
131
-
132
-
133
-
134
-
135
-
136
-
137
-
138
-
139
-
140
-
141
-
142
 |
 |

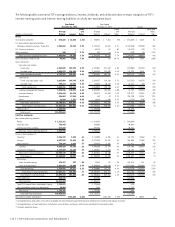
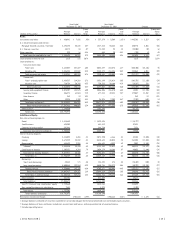
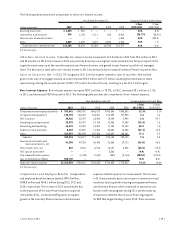
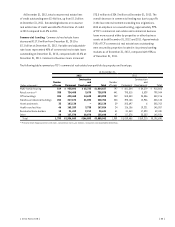
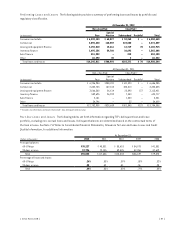
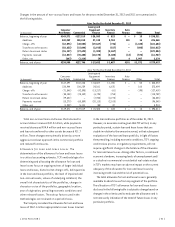
Loans and Leases The following tables set forth information about loans and leases held in TCF’s portfolio.
Year Ended December 31,
Compound Annual
Growth Rate
(Dollars in thousands) 2012 2011 2010 2009 2008
1-Year
2012/2011
5-Year
2012/2007
Consumer real estate:
First mortgage lien $ 4,239,524 $ 4,742,423 $ 4,893,887 $ 4,961,347 $ 4,881,662 (10.6)% (2.1)%
Junior lien 2,434,977 2,152,868 2,262,194 2,319,222 2,420,116 13.1 .8
Total consumer real estate 6,674,501 6,895,291 7,156,081 7,280,569 7,301,778 (3.2) (1.1)
Commercial:
Commercial real estate 3,080,942 3,198,698 3,328,216 3,269,003 2,984,156 (3.7) 3.8
Commercial business 324,293 250,794 317,987 449,516 506,887 29.3 (10.3)
Total commercial 3,405,235 3,449,492 3,646,203 3,718,519 3,491,043 (1.3) 1.8
Leasing and equipment finance(1) 3,198,017 3,142,259 3,154,478 3,071,429 2,486,082 1.8 8.7
Inventory finance 1,567,214 624,700 792,354 468,805 4,425 150.9 N.M.
Auto finance 552,833 3,628 – – – N.M. N.M.
Other 27,924 34,885 39,188 51,422 62,561 (20.0) (34.0)
Total loans and leases $15,425,724 $14,150,255 $14,788,304 $14,590,744 $13,345,889 9.0 4.3
N.M. Not Meaningful.
(1) Operating leases of $82.9 million and $69.6 million at December 31, 2012 and December 31, 2011, respectively, are included in other assets in the Consolidated Statements
of Financial Condition.
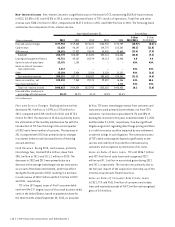
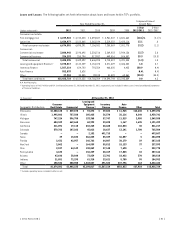
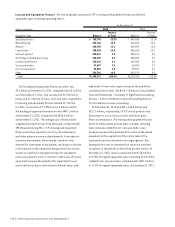
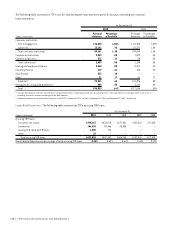
(In thousands) At December 31, 2012
Geographic Distribution:
Consumer
Real Estate Commercial
Leasing and
Equipment
Finance(1)
Inventory
Finance
Auto
Finance Other Total
Minnesota $2,500,128 $ 839,878 $ 94,872 $ 39,823 $ 11,965 $12,630 $ 3,499,296
Illinois 1,995,802 757,588 105,425 36,570 36,116 8,240 2,939,741
Michigan 747,224 596,750 133,368 57,747 11,519 2,980 1,549,588
Wisconsin 404,349 669,665 60,993 53,690 1,167 1,635 1,191,499
California 211,091 19,118 432,265 48,680 110,033 30 821,217
Colorado 579,762 107,262 45,012 18,627 13,141 1,700 765,504
Canada – – 2,152 491,715 – – 493,867
Texas 39 15,833 266,825 85,339 36,057 5 404,098
Florida 2,431 42,957 146,762 64,807 30,179 29 287,165
New York 2,062 – 164,559 55,812 15,123 37 237,593
Ohio 2,947 44,149 130,849 37,140 7,690 – 222,775
Pennsylvania 4,633 – 136,259 48,419 17,845 10 207,166
Arizona 43,646 38,840 73,839 13,701 18,422 370 188,818
Indiana 21,851 72,295 61,310 23,621 5,780 95 184,952
Other 158,536 200,900 1,343,527 491,523 237,796 163 2,432,445
Total $6,674,501 $3,405,235 $3,198,017 $1,567,214 $552,833 $27,924 $15,425,724
(1) Excludes operating leases included in other assets.
{ 2012 Form 10K } { 31 }