TCF Bank 2012 Annual Report Download - page 77
Download and view the complete annual report
Please find page 77 of the 2012 TCF Bank annual report below. You can navigate through the pages in the report by either clicking on the pages listed below, or by using the keyword search tool below to find specific information within the annual report.-
 1
1 -
2
-
3
-
4
-
5
-
6
-
7
-
8
-
9
-
10
-
11
-
12
-
13
-
14
-
15
-
16
-
17
-
18
-
19
-
20
-
21
-
22
-
23
-
24
-
25
-
26
-
27
-
28
-
29
-
30
-
31
-
32
-
33
-
34
-
35
-
36
-
37
-
38
-
39
-
40
-
41
-
42
-
43
-
44
-
45
-
46
-
47
-
48
-
49
-
50
-
51
-
52
-
53
-
54
-
55
-
56
-
57
-
58
-
59
-
60
-
61
-
62
-
63
-
64
-
65
-
66
-
 67
67 -
 68
68 -
 69
69 -
 70
70 -
 71
71 -
 72
72 -
 73
73 -
 74
74 -
 75
75 -
 76
76 -
 77
77 -
 78
78 -
 79
79 -
 80
80 -
 81
81 -
 82
82 -
 83
83 -
 84
84 -
 85
85 -
 86
86 -
 87
87 -
88
-
89
-
90
-
91
-
92
-
93
-
94
-
95
-
96
-
97
-
98
-
99
-
100
-
101
-
102
-
103
-
104
-
105
-
106
-
107
-
108
-
109
-
110
-
111
-
112
-
113
-
114
-
115
-
116
-
117
-
118
-
119
-
120
-
121
-
122
-
123
-
124
-
125
-
126
-
127
-
128
-
129
-
130
-
131
-
132
-
133
-
134
-
135
-
136
-
137
-
138
-
139
-
140
-
141
-
142
 |
 |

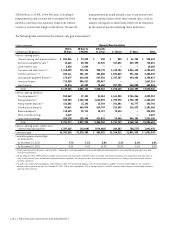
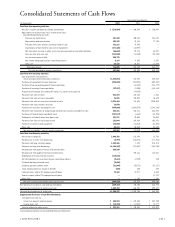
Consolidated Statements of Cash Flows
Year Ended December 31,
(In thousands) 2012 2011 2010
Cash flows from operating activities:
Net (loss) income available to common stockholders $ (218,490) $ 109,394 $ 150,947
Adjustments to reconcile net (loss) income to net cash
provided by operating activities:
Provision for credit losses 247,443 200,843 236,437
Depreciation and amortization 109,192 73,183 77,135
Proceeds from sales of loans and leases held for sale 161,221 37,395 –
Originations of loans held for sale, net of repayments (171,420) (32,987) –
Net (decrease) increase in other assets and accrued expenses and other liabilities (66,665) 92,176 62,397
Gains on sales of assets, net (141,048) (16,465) (32,483)
Loss on termination of debt 550,735 – –
Net income attributable to non-controlling interest 6,187 4,993 3,297
Other, net 20,445 28,011 17,994
Total adjustments 716,090 387,149 364,777
Net cash provided by operating activities 497,600 496,543 515,724
Cash flows from investing activities:
Loan originations and purchases,
net of principal collected on loans and leases (1,353,981) 812,988 429,228
Purchases of equipment for lease financing (938,228) (894,593) (802,587)
Purchase of leasing and equipment finance portfolios – (68,848) (186,779)
Purchase of inventory finance portfolios (37,527) (5,905) (168,612)
Acquisition of Gateway One Lending & Finance, LLC, net of cash acquired – (94,323) –
Proceeds from sales of loans 561,693 168,834 1,456
Proceeds from sales of lease receivables 76,596 125,072 10,670
Proceeds from sales of securities available for sale 2,074,494 181,696 1,330,955
Proceeds from sales of other securities 14,550 – –
Purchases of securities available for sale (645,880) (1,039,379) (1,788,142)
Proceeds from maturities of and principal collected on securities available for sale 202,431 586,816 436,574
Purchases of Federal Home Loan Bank stock (157,517) (6,663) (34,925)
Redemption of Federal Home Loan Bank stock 197,571 29,093 26,042
Proceeds from sales of real estate owned 132,044 107,428 103,236
Purchases of premises and equipment (44,082) (34,865) (36,088)
Other, net 40,418 34,334 32,420
Net cash provided by (used in) investing activities 122,582 (98,315) (646,552)
Cash flows from financing activities:
Net increase in deposits 1,848,782 616,889 16,796
Net decrease in short-term borrowings (3,797) (120,374) (117,814)
Proceeds from long-term borrowings 1,283,466 1,898 574,876
Payments on long-term borrowings (4,164,102) (376,087) (135,704)
Net proceeds from public offerings of preferred stock 263,240 – –
Net proceeds from public offering of common stock – 219,666 164,567
Redemption of trust preferred securities (115,010) – –
Net (distributions to) investment by non-controlling interest (3,411) (2,999) 810
Dividends paid on preferred stock (5,606) – –
Dividends paid on common stock (31,904) (30,772) (27,617)
Stock compensation tax (expense) benefit (659) 280 298
Common shares sold to TCF employee benefit plans 19,462 17,971 6,362
Treasury shares sold to TCF employee benefit plans – – 11,727
Other, net – 1,103 1,301
Net cash (used in) provided by financing activities (909,539) 327,575 495,602
Net (decrease) increase in cash and due from banks (289,357) 725,803 364,774
Cash and due from banks at beginning of year 1,389,704 663,901 299,127
Cash and due from banks at end of year $ 1,100,347 $ 1,389,704 $ 663,901
Supplemental disclosures of cash flow information:
Cash paid (received) for:
Interest on deposits and borrowings $ 108,524 $ 231,353 $ 258,750
Income taxes, net $ (13,376) $ (12,012) $ 72,777
Transfer of loans to other assets $ 137,311 $ 175,361 $ 214,079
See accompanying notes to consolidated financial statements.
{ 2012 Form 10K } { 61 }