TCF Bank 2012 Annual Report Download - page 45
Download and view the complete annual report
Please find page 45 of the 2012 TCF Bank annual report below. You can navigate through the pages in the report by either clicking on the pages listed below, or by using the keyword search tool below to find specific information within the annual report.-
 1
1 -
2
-
3
-
4
-
5
-
6
-
7
-
8
-
9
-
10
-
11
-
12
-
13
-
14
-
15
-
16
-
17
-
18
-
19
-
20
-
21
-
22
-
23
-
24
-
25
-
26
-
27
-
28
-
29
-
30
-
31
-
32
-
33
-
34
-
 35
35 -
 36
36 -
 37
37 -
 38
38 -
 39
39 -
 40
40 -
 41
41 -
 42
42 -
 43
43 -
 44
44 -
 45
45 -
 46
46 -
 47
47 -
 48
48 -
 49
49 -
 50
50 -
 51
51 -
 52
52 -
 53
53 -
 54
54 -
 55
55 -
56
-
57
-
58
-
59
-
60
-
61
-
62
-
63
-
64
-
65
-
66
-
67
-
68
-
69
-
70
-
71
-
72
-
73
-
74
-
75
-
76
-
77
-
78
-
79
-
80
-
81
-
82
-
83
-
84
-
85
-
86
-
87
-
88
-
89
-
90
-
91
-
92
-
93
-
94
-
95
-
96
-
97
-
98
-
99
-
100
-
101
-
102
-
103
-
104
-
105
-
106
-
107
-
108
-
109
-
110
-
111
-
112
-
113
-
114
-
115
-
116
-
117
-
118
-
119
-
120
-
121
-
122
-
123
-
124
-
125
-
126
-
127
-
128
-
129
-
130
-
131
-
132
-
133
-
134
-
135
-
136
-
137
-
138
-
139
-
140
-
141
-
142
 |
 |

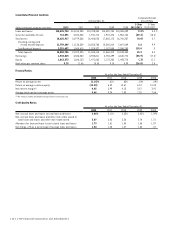
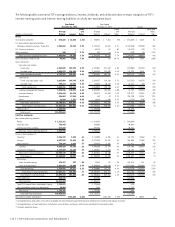
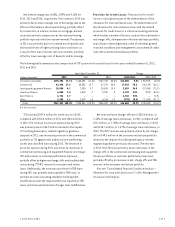
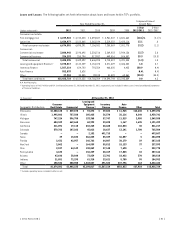
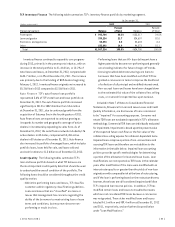
The following table presents the components of other non-interest income.
Year Ended December 31, Compound Annual Growth Rate
(Dollars in thousands) 2012 2011 2010 2009 2008
1-Year
2012/2011
5-Year
2012/2007
Servicing fee income $ 6,235 $ 484 $ – $ – $ – N.M. N.M.
Investments and insurance 920 1,105 1,111 643 9,405 (16.7)% (38.3)%
Gains on sale of education loans – – – – 1,456 N.M. (100.0)
Other 6,029 1,845 4,473 4,596 1,246 N.M. (.7)
Total other non-interest income $13,184 $3,434 $5,584 $5,239 $12,107 N.M. (6.6)
N.M. Not Meaningful.
Other Non-Interest Income Total other non-interest income increased to $13.2 million in 2012 from $3.4 million in 2011
and $5.6 million in 2010. The increase in 2012 was primarily driven by servicing fee income related to the full year impact of the
acquisition and ramp-up of the recently acquired auto finance business and growth in auto finance’s portfolio of managed
loans. The decrease in total other non-interest income in 2011 was primarily due to reduced inventory finance inspection fees.
Gains on Securities, Net In 2012, TCF recognized $102.2 million in gains related to sales of securities. Net realized
gains on the sale of mortgage-backed securities totaled $90.2 million with $77 million resulting from the balance sheet
repositioning. During the second quarter of 2012, TCF sold its Visa Class B stock, resulting in a net $13.1 million gain.
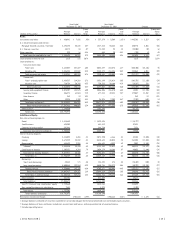
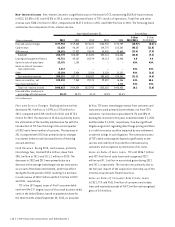
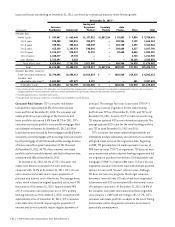
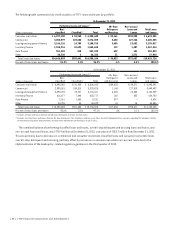
Non-Interest Expense Non-interest expense increased $598.1 million, or 78.2%, in 2012, increased $8.1 million or 1.1%,
in 2011, and decreased $320 thousand in 2010. The following table presents the components of non-interest expense.
Year Ended December 31, Compound Annual Growth Rate
(Dollars in thousands) 2012 2011 2010 2009 2008
1-Year
2012/2011
5-Year
2012/2007
Compensation and employee benefits $ 393,841 $348,792 $346,072 $345,868 $365,653 12.9% 3.1%
Occupancy and equipment 130,792 126,437 126,551 126,292 127,953 3.4 1.6
FDIC insurance 30,425 28,747 23,584 19,109 2,990 5.8 92.7
Operating lease depreciation 25,378 30,007 37,106 22,368 17,458 (15.4) 7.6
Advertising and marketing 16,572 10,034 13,062 17,134 19,150 65.2 (.3)
Deposit account premiums 8,669 22,891 17,304 30,682 16,888 (62.1) 12.3
Other 163,897 146,909 147,884 143,697 150,061 11.6 3.3
Subtotal 769,574 713,817 711,563 705,150 700,153 7.8 3.8
Foreclosed real estate and
repossessed assets, net 41,358 49,238 40,385 31,886 19,170 (16.0) 48.8
Other credit costs, net 887 2,816 6,018 12,137 3,296 (68.5) (13.2)
FDIC special assessment – – – 8,362 – N.M. N.M.
Visa indemnification expense – (1,420) (1,631) (880) (3,766) (100.0) (100.0)
Loss on termination of debt 550,735 – – – – N.M. N.M.
Total non-interest expense $1,362,554 $764,451 $756,335 $756,655 $718,853 78.2% 15.8%
N.M. Not Meaningful.
Compensation and Employee Benefits Compensation
and employee benefits expense totaled $393.8 million,
$348.8 million and $346.1 million during 2012, 2011 and
2010, respectively. The increase in 2012 was primarily due
to the expansion of the auto finance business acquired
in November 2011, increased staffing levels to support
growth in the inventory finance business and increased
expense related to pension re-measurement. The increase
in 2011 was primarily due to an increase in commissions and
incentives due to growth in leasing and equipment finance
and inventory finance, which continued to expand its core
business with new programs during 2011 and the ramp-up
of expenses related to the exclusive financing program
for BRP that began funding in early 2012. These increases
{ 2012 Form 10K } { 29 }