TCF Bank 2012 Annual Report Download - page 123
Download and view the complete annual report
Please find page 123 of the 2012 TCF Bank annual report below. You can navigate through the pages in the report by either clicking on the pages listed below, or by using the keyword search tool below to find specific information within the annual report.-
 1
1 -
2
-
3
-
4
-
5
-
6
-
7
-
8
-
9
-
10
-
11
-
12
-
13
-
14
-
15
-
16
-
17
-
18
-
19
-
20
-
21
-
22
-
23
-
24
-
25
-
26
-
27
-
28
-
29
-
30
-
31
-
32
-
33
-
34
-
35
-
36
-
37
-
38
-
39
-
40
-
41
-
42
-
43
-
44
-
45
-
46
-
47
-
48
-
49
-
50
-
51
-
52
-
53
-
54
-
55
-
56
-
57
-
58
-
59
-
60
-
61
-
62
-
63
-
64
-
65
-
66
-
67
-
68
-
69
-
70
-
71
-
72
-
73
-
74
-
75
-
76
-
77
-
78
-
79
-
80
-
81
-
82
-
83
-
84
-
85
-
86
-
87
-
88
-
89
-
90
-
91
-
92
-
93
-
94
-
95
-
96
-
97
-
98
-
99
-
100
-
101
-
102
-
103
-
104
-
105
-
106
-
107
-
108
-
109
-
110
-
111
-
112
-
 113
113 -
 114
114 -
 115
115 -
 116
116 -
 117
117 -
 118
118 -
 119
119 -
 120
120 -
 121
121 -
 122
122 -
 123
123 -
 124
124 -
 125
125 -
 126
126 -
 127
127 -
 128
128 -
 129
129 -
 130
130 -
 131
131 -
 132
132 -
 133
133 -
134
-
135
-
136
-
137
-
138
-
139
-
140
-
141
-
142
 |
 |

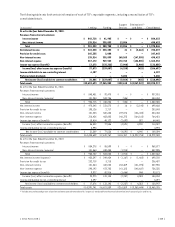
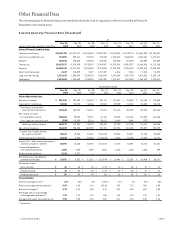
Other Financial Data
The selected quarterly financial data presented below should be read in conjunction with the Consolidated Financial
Statements and related notes.
Selected Quarterly Financial Data (Unaudited)
At
(Dollars in thousands, except per-share data)
Dec. 31,
2012
Sep. 30,
2012
Jun. 30,
2012
Mar. 31,
2012
Dec. 31,
2011
Sep. 30,
2011
Jun. 30,
2011
Mar. 31,
2011
Selected Financial Condition Data:
Total loans and leases $15,425,724 $15,218,217 $15,234,504 $15,207,936 $14,150,255 $14,339,715 $14,631,945 $14,796,541
Securities available for sale 712,091 559,671 757,233 728,894 2,324,038 2,600,806 2,463,367 2,172,017
Goodwill 225,640 225,640 225,640 225,640 225,640 152,599 152,599 152,599
Total assets 18,225,917 17,878,393 17,870,597 17,833,457 18,979,388 19,092,027 18,834,416 18,712,136
Deposits 14,050,786 13,721,419 13,704,306 12,759,040 12,202,004 12,320,502 11,939,476 12,043,684
Short-term borrowings 2,619 115,529 7,487 1,157,189 6,416 7,204 9,514 12,898
Long-term borrowings 1,931,196 1,936,988 2,075,923 1,962,053 4,381,664 4,397,750 4,415,362 4,533,176
Total equity 1,876,643 1,764,669 1,755,908 1,549,325 1,878,627 1,872,044 1,769,619 1,724,471
Three Months Ended
Dec. 31,
2012
Sep. 30,
2012
Jun. 30,
2012
Mar. 31,
2012
Dec. 31,
2011
Sep. 30,
2011
Jun. 30,
2011
Mar. 31,
2011
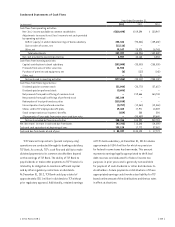
Selected Operations Data:
Net interest income $ 201,063 $ 200,559 $ 198,224 $ 180,173 $ 173,434 $ 176,064 $ 176,150 $ 174,040
Provision for credit losses 48,520 96,275 54,106 48,542 59,249 52,315 44,005 45,274
Net interest income after
provision for credit losses 152,543 104,284 144,118 131,631 114,185 123,749 132,145 128,766
Non-interest income:
Fees and other revenue 100,665 99,025 99,767 88,734 92,448 116,108 114,369 114,246
(Loss) gains on securities, net (528) 13,033 13,116 76,611 5,842 1,648 (227) –
Total non-interest income 100,137 112,058 112,883 165,345 98,290 117,756 114,142 114,246
Non-interest expense 214,049 196,808 202,989 748,708 187,533 188,848 195,091 192,979
Income (loss) before income
tax expense (benefit) 38,631 19,534 54,012 (451,732) 24,942 52,657 51,196 50,033
Income tax expense (benefit) 10,540 6,304 20,542 (170,244) 7,424 19,159 19,086 18,772
Income (loss) after income tax expense
income tax expense (benefit) 28,091 13,230 33,470 (281,488) 17,518 33,498 32,110 31,261
Income attributable to
non-controlling interest 1,306 1,536 1,939 1,406 1,075 1,243 1,686 989
Preferred stock dividends 3,234 2,372 – – – – – –
Net income (loss) available to
common stockholders $ 23,551 $ 9,322 $ 31,531 $ (282,894) $ 16,443 $ 32,255 $ 30,424 $ 30,272
Per common share:
Basic earnings $ .15 $ .06 $ .20 $ (1.78) $ .10 $ .20 $ .19 $ .21
Diluted earnings $ .15 $ .06 $ .20 $ (1.78) $ .10 $ .20 $ .19 $ .21
Dividends declared $ .05 $ .05 $ .05 $ .05 $ .05 $ .05 $ .05 $ .05
Financial Ratios:
Return on average assets(1) .63% .30% .76% (5.96)% .37% .71% .68% .68%
Return on average common equity(1) 5.93 2.36 8.13 (63.38) 3.55 7.12 7.00 8.00
Net interest margin(1) 4.79 4.85 4.86 4.14 3.92 3.96 4.02 4.06
Net charge-offs as a percentage
of average loans and leases(1) 1.18 2.74 1.18 1.06 1.63 1.48 1.19 1.51
Average total equity to average assets 9.92 9.96 8.96 9.52 9.81 9.58 9.32 8.24
(1) Annualized.
{ 2012 Form 10K } { 107 }