TCF Bank 2012 Annual Report Download - page 53
Download and view the complete annual report
Please find page 53 of the 2012 TCF Bank annual report below. You can navigate through the pages in the report by either clicking on the pages listed below, or by using the keyword search tool below to find specific information within the annual report.-
 1
1 -
2
-
3
-
4
-
5
-
6
-
7
-
8
-
9
-
10
-
11
-
12
-
13
-
14
-
15
-
16
-
17
-
18
-
19
-
20
-
21
-
22
-
23
-
24
-
25
-
26
-
27
-
28
-
29
-
30
-
31
-
32
-
33
-
34
-
35
-
36
-
37
-
38
-
39
-
40
-
41
-
42
-
 43
43 -
 44
44 -
 45
45 -
 46
46 -
 47
47 -
 48
48 -
 49
49 -
 50
50 -
 51
51 -
 52
52 -
 53
53 -
 54
54 -
 55
55 -
 56
56 -
 57
57 -
 58
58 -
 59
59 -
 60
60 -
 61
61 -
 62
62 -
 63
63 -
64
-
65
-
66
-
67
-
68
-
69
-
70
-
71
-
72
-
73
-
74
-
75
-
76
-
77
-
78
-
79
-
80
-
81
-
82
-
83
-
84
-
85
-
86
-
87
-
88
-
89
-
90
-
91
-
92
-
93
-
94
-
95
-
96
-
97
-
98
-
99
-
100
-
101
-
102
-
103
-
104
-
105
-
106
-
107
-
108
-
109
-
110
-
111
-
112
-
113
-
114
-
115
-
116
-
117
-
118
-
119
-
120
-
121
-
122
-
123
-
124
-
125
-
126
-
127
-
128
-
129
-
130
-
131
-
132
-
133
-
134
-
135
-
136
-
137
-
138
-
139
-
140
-
141
-
142
 |
 |
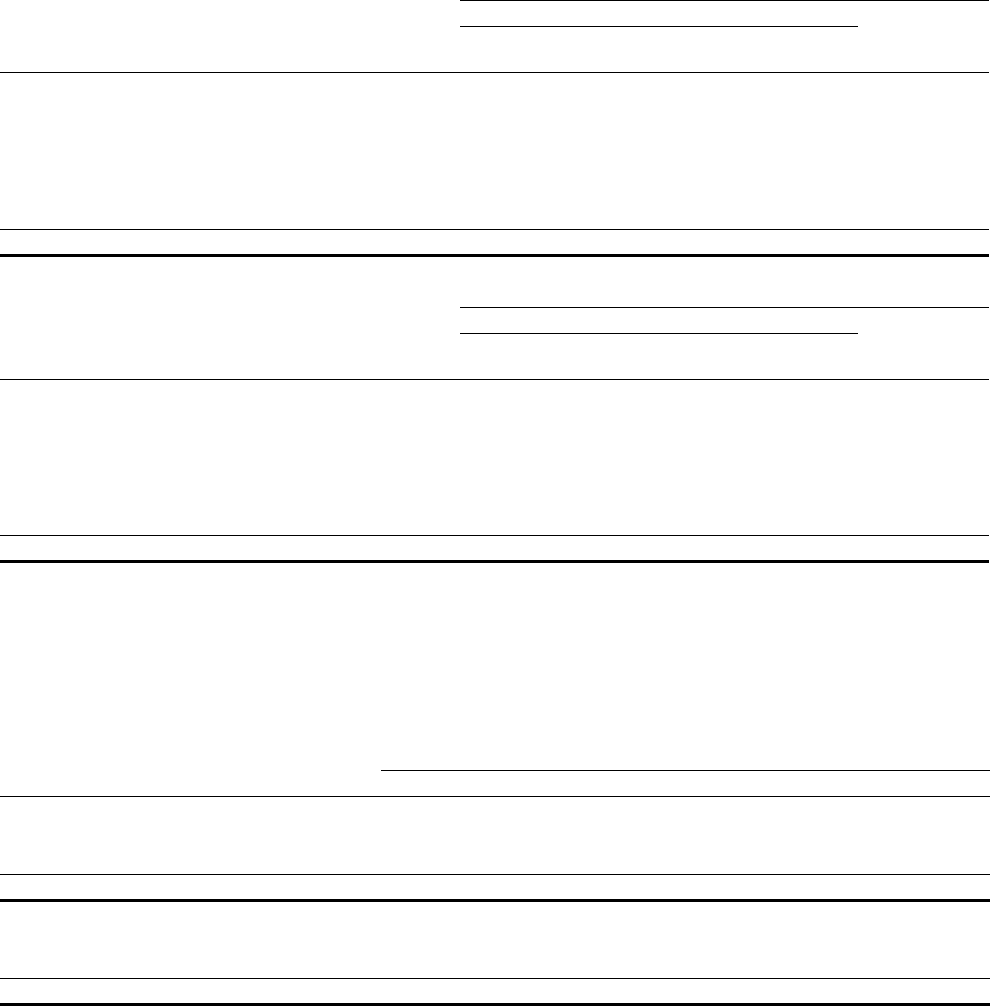
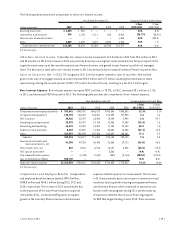
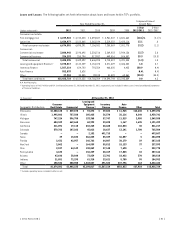
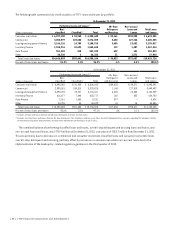
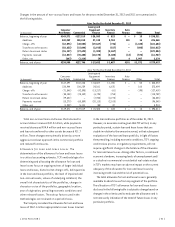
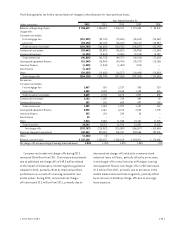
Performing Loans and Leases The following table provides a summary of performing loans and leases by portfolio and
regulatory classification.
At December 31, 2012
Non-classified Classified(1)
(In thousands) Pass
Special
Mention Substandard Doubtful Total
Consumer real estate $ 6,232,153 $ 65,027 $ 53,260 $ – $ 6,350,440
Commercial 2,890,420 160,559 223,880 – 3,274,859
Leasing and equipment finance 3,150,510 15,616 14,719 70 3,180,915
Inventory finance 1,495,156 59,760 10,692 – 1,565,608
Auto finance 551,282 – 818 – 552,100
Other 26,290 30 2 – 26,322
Total loans and leases $14,345,811 $300,992 $303,371 $ 70 $14,950,244
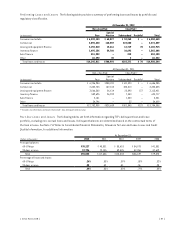
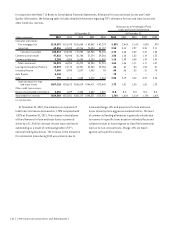
At December 31, 2011
Non-classified Classified(1)
(In thousands) Pass
Special
Mention Substandard Doubtful Total
Consumer real estate $ 6,206,984 $ 288,281 $ 141,020 $ – $ 6,636,285
Commercial 2,802,703 187,812 330,310 – 3,320,825
Leasing and equipment finance 3,066,580 26,614 22,090 137 3,115,421
Inventory finance 589,695 26,982 7,040 – 623,717
Auto finance 2,181 – 1,050 – 3,231
Other 34,796 – 33 – 34,829
Total loans and leases $ 12,702,939 $ 529,689 $ 501,543 $137 $13,734,308
(1) Excludes classified loans and leases that are 60+ days delinquent and accruing.
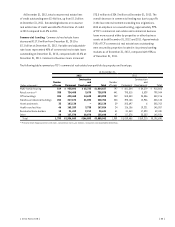
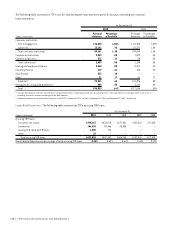
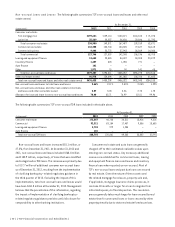
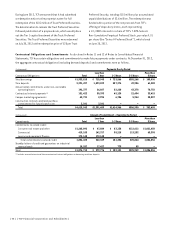
Past Due Loans and Leases The following tables set forth information regarding TCF’s delinquent loan and lease
portfolio, excluding non-accrual loans and leases. Delinquent balances are determined based on the contractual terms of
the loan or lease. See Note 7 of Notes to Consolidated Financial Statements, Allowance for Loan and Lease Losses and Credit
Quality Information, for additional information.
At December 31,
(Dollars in thousands) 2012 2011 2010 2009 2008
Principal balances:
60-89 days $38,227 $ 45,531 $ 55,618 $ 54,073 $41,851
90 days or more 57,796 72,105 59,425 52,056 37,619
Total $96,023 $117,636 $115,043 $106,129 $79,470
Percentage of loans and leases:
60-89 days .26% .33% .39% .38% .32%
90 days or more .38 .52 .41 .36 .28
Total .64% .85% .80% .74% .60%
{ 2012 Form 10K } { 37 }