TCF Bank 2012 Annual Report Download - page 113
Download and view the complete annual report
Please find page 113 of the 2012 TCF Bank annual report below. You can navigate through the pages in the report by either clicking on the pages listed below, or by using the keyword search tool below to find specific information within the annual report.-
 1
1 -
2
-
3
-
4
-
5
-
6
-
7
-
8
-
9
-
10
-
11
-
12
-
13
-
14
-
15
-
16
-
17
-
18
-
19
-
20
-
21
-
22
-
23
-
24
-
25
-
26
-
27
-
28
-
29
-
30
-
31
-
32
-
33
-
34
-
35
-
36
-
37
-
38
-
39
-
40
-
41
-
42
-
43
-
44
-
45
-
46
-
47
-
48
-
49
-
50
-
51
-
52
-
53
-
54
-
55
-
56
-
57
-
58
-
59
-
60
-
61
-
62
-
63
-
64
-
65
-
66
-
67
-
68
-
69
-
70
-
71
-
72
-
73
-
74
-
75
-
76
-
77
-
78
-
79
-
80
-
81
-
82
-
83
-
84
-
85
-
86
-
87
-
88
-
89
-
90
-
91
-
92
-
93
-
94
-
95
-
96
-
97
-
98
-
99
-
100
-
101
-
102
-
 103
103 -
 104
104 -
 105
105 -
 106
106 -
 107
107 -
 108
108 -
 109
109 -
 110
110 -
 111
111 -
 112
112 -
 113
113 -
 114
114 -
 115
115 -
 116
116 -
 117
117 -
 118
118 -
 119
119 -
 120
120 -
 121
121 -
 122
122 -
 123
123 -
124
-
125
-
126
-
127
-
128
-
129
-
130
-
131
-
132
-
133
-
134
-
135
-
136
-
137
-
138
-
139
-
140
-
141
-
142
 |
 |
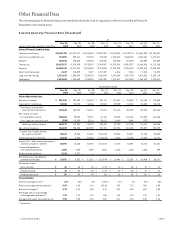
Management assesses the appropriate classification
of financial assets and liabilities within the fair value
hierarchy by monitoring the level of availability of
observable market information. Changes in market and/
or economic conditions, as well as to Company valuation
models may require the transfer of financial instruments
from one fair value level to another. Such transfers, if
any, represent the fair values as of the beginning of the
quarter in which the transfer occurred. For the year ended
December 31, 2012, TCF transferred approximately $1.1
million of securities from Level 3 to Level 1 due to the
adoption of new FASB guidance in the first quarter of 2012.
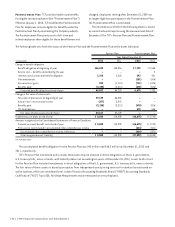
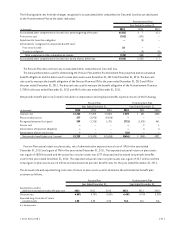
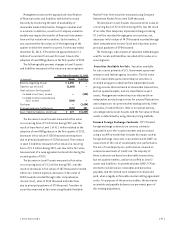
The following table presents changes in Level 3 assets
and liabilities measured at fair value on a recurring basis.
Year Ended December 31, 2012
(In thousands) Assets Liabilities
Balance, beginning of year $ 1,450 $ –
Transfers out of Level 3 (1,098) –
Total net losses for the period:
Included in net (loss) income – (150)
Included in other comprehensive
(loss) income (100) –
Purchases – (1,434)
Principal paydowns/Settlements (125) 357
Asset (liability) balance, end of year $ 127 $(1,227)
The decrease in Level 3 assets measured at fair value
on a recurring basis of $1.3 million during 2012, was the
result of transfers to Level 1 of $1.1 million related to the
adoption of new FASB guidance in the first quarter of 2012,
decreases in fair value of $100 thousand and reductions
due to principal paydowns of $125 thousand. The increase
in Level 3 liabilities measured at fair value on a recurring
basis of $1.2 million during 2012, was due to the fair value
measurement of a swap agreement entered into during the
second quarter of 2012.
The decrease in Level 3 assets measured at fair value
on a recurring basis of $1.2 million during 2011, was the
result of decreases in fair values of $672 thousand recorded
within non-interest expense, decreases in fair value of
$82 thousand recorded through other comprehensive
income (loss), sales of $100 thousand and reductions
due to principal paydowns of $70 thousand. Transfers to
securities measured at fair value using Readily Available
Market Prices from securities measured using Company
Determined Market Prices were $264 thousand.
The decrease in Level 3 assets measured at fair value on
a recurring basis of $2.6 million during 2010, was the result
of an other than temporary impairment charges totaling
$2.1 million recorded through gains on securities, net,
decreases in fair values of $417 thousand recorded through
other comprehensive income (loss) and reductions due to
principal paydowns of $90 thousand.
The following is a description of valuation methodologies
used for assets and liabilities recorded at fair value on a
recurring basis.
Securities Available for Sale Securities available
for sale consist primarily of U.S. Government sponsored
enterprise and federal agency securities. The fair value
of U.S. Government sponsored enterprise securities is
recorded using prices obtained from independent asset
pricing services that are based on observable transactions,
but not quoted markets, and are classified as Level 2
assets. Management reviews the prices obtained from
independent asset pricing services for unusual fluctuations
and comparisons to current market trading activity. Other
securities, for which there is little or no market activity,
are categorized as Level 3 assets and the fair value of these
assets is determined by using internal pricing methods.
Forward Foreign Exchange Contracts TCF’s forward
foreign exchange contracts are currency contracts
executed in over-the-counter markets and are valued
using a cash flow model that includes key inputs such as
foreign exchange rates and, in accordance with GAAP, an
assessment of the risk of counterparty non-performance.
The risk of counterparty non-performance is based on
external assessments of credit risk. The majority of
these contracts are based on observable transactions,
but not quoted markets, and are classified as Level 2
assets and liabilities. As permitted under GAAP, TCF has
elected to net derivative receivables and derivative
payables and the related cash collateral received and
paid, when a legally enforceable master netting agreement
exists. For purposes of the previous tables, the derivative
receivable and payable balances are presented gross of
this netting adjustment.
{ 2012 Form 10K } { 97 }