TCF Bank 2012 Annual Report Download - page 42
Download and view the complete annual report
Please find page 42 of the 2012 TCF Bank annual report below. You can navigate through the pages in the report by either clicking on the pages listed below, or by using the keyword search tool below to find specific information within the annual report.-
 1
1 -
2
-
3
-
4
-
5
-
6
-
7
-
8
-
9
-
10
-
11
-
12
-
13
-
14
-
15
-
16
-
17
-
18
-
19
-
20
-
21
-
22
-
23
-
24
-
25
-
26
-
27
-
28
-
29
-
30
-
31
-
 32
32 -
 33
33 -
 34
34 -
 35
35 -
 36
36 -
 37
37 -
 38
38 -
 39
39 -
 40
40 -
 41
41 -
 42
42 -
 43
43 -
 44
44 -
 45
45 -
 46
46 -
 47
47 -
 48
48 -
 49
49 -
 50
50 -
 51
51 -
 52
52 -
53
-
54
-
55
-
56
-
57
-
58
-
59
-
60
-
61
-
62
-
63
-
64
-
65
-
66
-
67
-
68
-
69
-
70
-
71
-
72
-
73
-
74
-
75
-
76
-
77
-
78
-
79
-
80
-
81
-
82
-
83
-
84
-
85
-
86
-
87
-
88
-
89
-
90
-
91
-
92
-
93
-
94
-
95
-
96
-
97
-
98
-
99
-
100
-
101
-
102
-
103
-
104
-
105
-
106
-
107
-
108
-
109
-
110
-
111
-
112
-
113
-
114
-
115
-
116
-
117
-
118
-
119
-
120
-
121
-
122
-
123
-
124
-
125
-
126
-
127
-
128
-
129
-
130
-
131
-
132
-
133
-
134
-
135
-
136
-
137
-
138
-
139
-
140
-
141
-
142
 |
 |

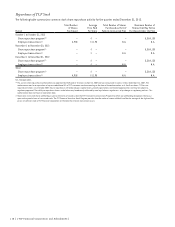
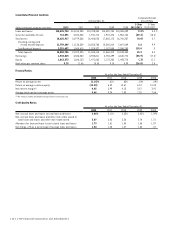
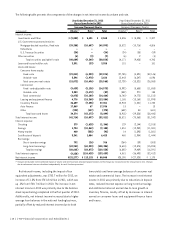
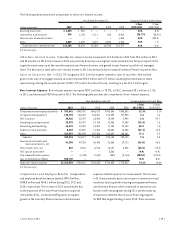
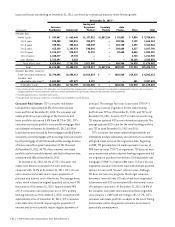
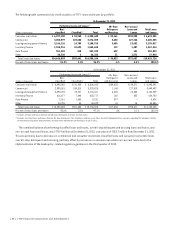
The following table presents the components of the changes in net interest income by volume and rate.
Year Ended December 31, 2012
Versus Same Period in 2011
Year Ended December 31, 2011
Versus Same Period in 2010
Increase (Decrease) Due to Increase (Decrease) Due to
(In thousands) Volume(1) Rate(1) Total Volume(1) Rate(1) Total
Interest income:
Investments and Other $ (2,883) $ 5,451 $ 2,568 $ 5,355 $ (3,028) $ 2,327
U.S. Government sponsored entities:
Mortgage-backed securities, fixed rate (39,388) (10,607) (49,995) 15,522 (10,716) 4,806
Debentures – – – – – –
U.S. Treasury Securities (34) – (34) (24) (35) (59)
Other securities (6) (3) (9) (6) 2 (4)
Total securities available for sale (40,689) (9,349) (50,038) 14,171 (9,428) 4,743
Loans and leases held for sale 3,591 (33) 3,558 131 – 131
Loans and leases:
Consumer home equity:
Fixed-rate (22,841) (6,353) (29,194) (27,755) (4,391) (32,146)
Variable-rate 5,596 (1,970) 3,626 12,443 (6,347) 6,096
Total consumer real estate (15,072) (10,496) (25,568) (12,729) (13,321) (26,050)
Commercial:
Fixed- and adjustable-rate (9,439) (5,136) (14,575) (5,992) (5,658) (11,650)
Variable-rate 3,383 (3,472) (89) (832) 970 138
Total commercial (4,475) (10,189) (14,664) (6,740) (4,772) (11,512)
Leasing and equipment finance 4,776 (18,360) (13,584) 1,165 (13,160) (11,995)
Inventory finance 36,609 (9,258) 27,351 12,903 (1,201) 11,702
Auto finance 17,869 67 17,936 13 – 13
Other (233) (137) (370) (639) 38 (601)
Total loans and leases 34,374 (43,273) (8,899) (8,915) (29,528) (38,443)
Total interest income (42,714) (10,097) (52,811) 38,821 (70,063) (31,242)
Interest expense:
Checking 279 (1,625) (1,346) 129 (2,144) (2,015)
Savings 1,754 (10,862) (9,108) 1,851 (12,932) (11,081)
Money market 460 (552) (92) 14 (1,595) (1,581)
Certificates of deposit 5,341 1,084 6,425 460 (1,904) (1,444)
Borrowings:
Short-term borrowings 792 (26) 766 (264) (39) (303)
Long-term borrowings (69,951) (60,353) (130,304) (3,614) (12,374) (15,988)
Total borrowings (60,665) (68,873) (129,538) (6,802) (9,489) (16,291)
Total interest expense (9,230) (124,429) (133,659) 4,081 (36,493) (32,412)
Net interest income $(32,277) $ 113,125 $ 80,848 $28,190 $(27,020) $ 1,170
(1) Changes attributable to the combined impact of volume and rate have been allocated proportionately to the change due to volume and the change due to rate. Changes
due to volume and rate are calculated independently for each line item presented.
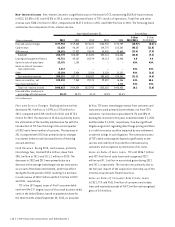
Net interest income, including the impact of tax
equivalent adjustments, was $782.7 million for 2012, an
increase of 11.5% from $701.8 million in 2011, which was
up .2% from $700.7 million in 2010. The increase in net
interest income in 2012 was primarily due to the balance
sheet repositioning completed in the first quarter of 2012.
Additionally, net interest income increased due to higher
average loan balances in the national lending business,
partially offset by reduced interest income due to both
lower yields and lower average balances of consumer real
estate and commercial loans. The increase in net interest
income in 2011 was primarily due to reductions in deposit
rates, reduced interest expense on long-term borrowings
and additional interest earned due to loan growth in
inventory finance, mostly offset by decreases in interest
earned on consumer loans and equipment finance loans
and leases.
{ 26 } { TCF Financial Corporation and Subsidiaries }