Singapore Airlines 2009 Annual Report Download - page 95
Download and view the complete annual report
Please find page 95 of the 2009 Singapore Airlines annual report below. You can navigate through the pages in the report by either clicking on the pages listed below, or by using the keyword search tool below to find specific information within the annual report.-
 1
1 -
2
-
3
-
4
-
5
-
6
-
7
-
8
-
9
-
10
-
11
-
12
-
13
-
14
-
15
-
16
-
17
-
18
-
19
-
20
-
21
-
22
-
23
-
24
-
25
-
26
-
27
-
28
-
29
-
30
-
31
-
32
-
33
-
34
-
35
-
36
-
37
-
38
-
39
-
40
-
41
-
42
-
43
-
44
-
45
-
46
-
47
-
48
-
49
-
50
-
51
-
52
-
53
-
54
-
55
-
56
-
57
-
58
-
59
-
60
-
61
-
62
-
63
-
64
-
65
-
66
-
67
-
68
-
69
-
70
-
71
-
72
-
73
-
74
-
75
-
76
-
77
-
78
-
79
-
80
-
81
-
82
-
83
-
84
-
 85
85 -
 86
86 -
 87
87 -
 88
88 -
 89
89 -
 90
90 -
 91
91 -
 92
92 -
 93
93 -
 94
94 -
 95
95 -
 96
96 -
 97
97 -
 98
98 -
 99
99 -
 100
100 -
 101
101 -
 102
102 -
 103
103 -
 104
104 -
 105
105 -
106
-
107
-
108
-
109
-
110
-
111
-
112
-
113
-
114
-
115
-
116
-
117
-
118
-
119
-
120
-
121
-
122
-
123
-
124
-
125
-
126
-
127
-
128
-
129
-
130
-
131
-
132
-
133
-
134
-
135
-
136
-
137
-
138
-
139
-
140
-
141
-
142
-
143
-
144
-
145
-
146
-
147
-
148
-
149
-
150
-
151
-
152
-
153
-
154
-
155
-
156
-
157
-
158
-
159
-
160
-
161
-
162
-
163
-
164
-
165
-
166
-
167
-
168
-
169
-
170
-
171
-
172
-
173
-
174
-
175
-
176
-
177
-
178
-
179
-
180
-
181
-
182
-
183
-
184
-
185
-
186
-
187
-
188
-
189
-
190
-
191
-
192
-
193
-
194
-
195
-
196
-
197
-
198
-
199
-
200
-
201
-
202
-
203
-
204
-
205
-
206
-
207
-
208
-
209
-
210
-
211
-
212
-
213
-
214
-
215
-
216
-
217
-
218
-
219
-
220
-
221
-
222
-
223
-
224
 |
 |

93
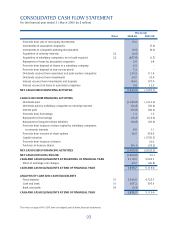
The Group
Notes 2008-09 2007-08
Proceeds from sale of non-equity investments 13.6 -
Investments in associated companies - (7.6)
Investments in companies pending incorporation (3.9) (8.2)
Acquisition of minority interests 22 (0.6) -
Acquisition of subsidiary companies, net of cash acquired 22 (457.8) (1.5)
Repayment of loans by associated companies 2.8 0.8
Proceeds from disposal of shares in a subsidiary company 0.3 -
Proceeds from disposal of non-current assets 5.2 -
Dividends received from associated and joint venture companies 134.3 111.4
Dividends received from investments 24.5 35.6
Interest received from investments and deposits 84.6 177.0
Interest received on loans to associated companies 9.8 12.5
NET CASH USED IN INVESTING ACTIVITIES (1,346.6) (1,301.1)
CASH FLOW FROM FINANCING ACTIVITIES
Dividends paid (1,185.8) (1,313.2)
Dividends paid by subsidiary companies to minority interests (74.4) (56.4)
Interest paid (69.8) (82.2)
Proceeds from borrowings 1.9 1.5
Repayment of borrowings (15.2) (114.0)
Repayment of long-term lease liabilities (54.8) (56.4)
Proceeds from issuance of share capital by subsidiary companies
to minority interests 8.8 1.1
Proceeds from exercise of share options 50.6 356.6
Capital reduction - (1,556.3)
Proceeds from issuance of shares - 20.2
Purchase of treasury shares (64.1) (33.2)
NET CASH USED IN FINANCING ACTIVITIES (1,402.8) (2,832.3)
NET CASH (OUTFLOW)/INFLOW (1,304.0) 72.1
CASH AND CASH EQUIVALENTS AT BEGINNING OF FINANCIAL YEAR 5,119.0 5,093.7
Effect of exchange rate changes 23.7 (46.8)
CASH AND CASH EQUIVALENTS AT END OF FINANCIAL YEAR 3,838.7 5,119.0
ANALYSIS OF CASH AND CASH EQUIVALENTS
Fixed deposits 31 3,540.8 4,723.7
Cash and bank 31 307.2 395.3
Bank overdrafts 33 (9.3) -
CASH AND CASH EQUIVALENTS AT END OF FINANCIAL YEAR 3,838.7 5,119.0
The notes on pages 94 to 204 form an integral part of these fi nancial statements.
CONSOLIDATED CASH FLOW STATEMENT
For the fi nancial year ended 31 March 2009 (in $ million)